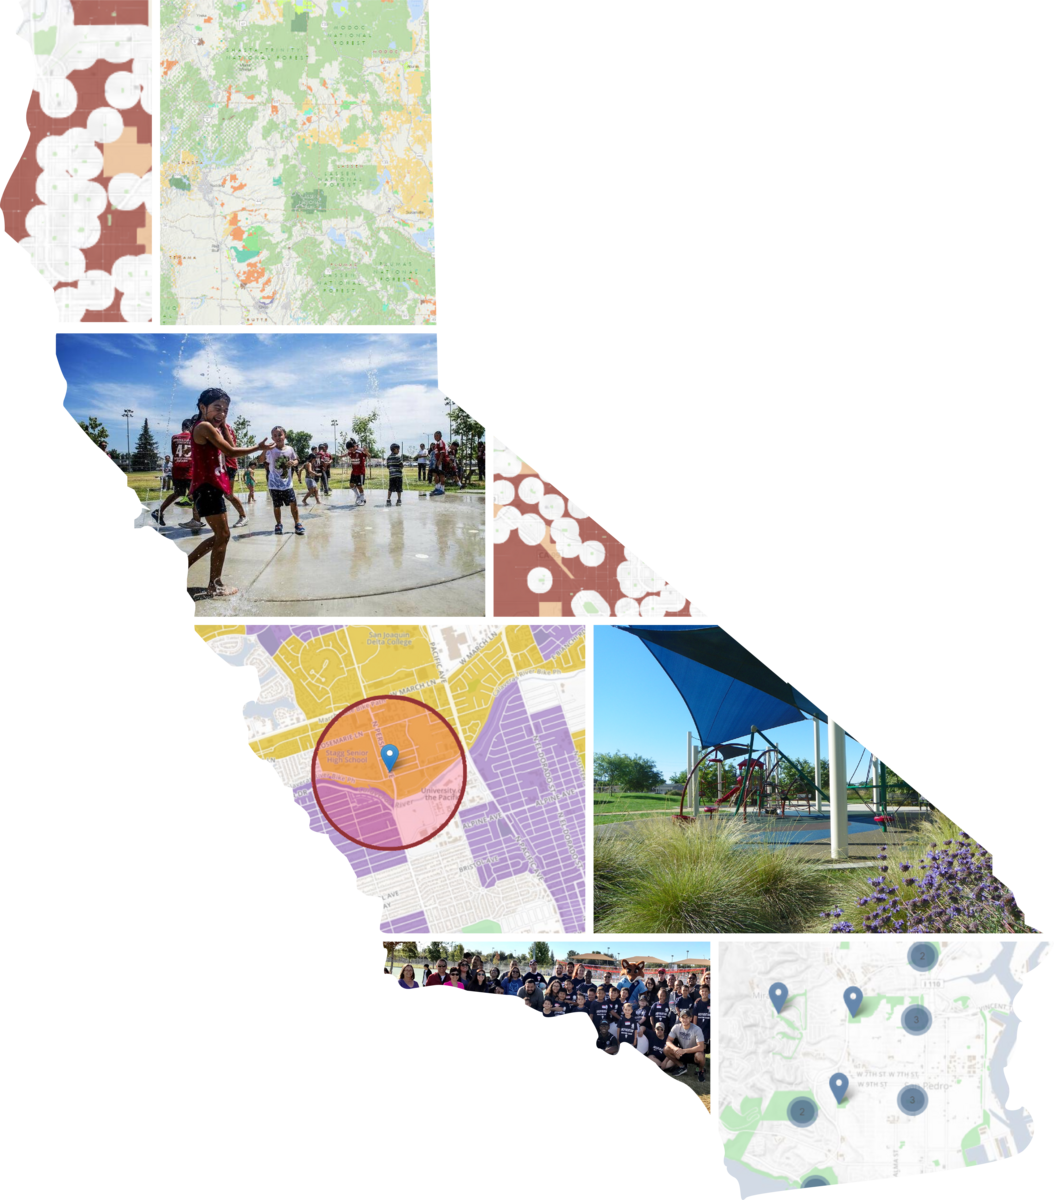
California's Vision for Park Equity
2000–2020: Transforming Park Access with Data and Technology
Welcome to California's Vision of Park Equity
This report is produced by the California Department of Parks and Recreation's (State Parks) Community Engagement Division — Office of Grants and Local Services (OGALS). Since 1965, more than 7,580 parks throughout California have been created or improved with grants administered by OGALS. Currently, over 700 local agencies partner with OGALS to improve the health and wellness of California's almost 40 million residents by providing close to home park access.
OGALS GRANTS: parks.ca.gov/grants
Email: SCORP@parks.ca.gov
OGALS street address:
California Department of Parks and Recreation
Office of Grants and Local Services
1416 Ninth Street, Room 918
Sacramento, CA 95814
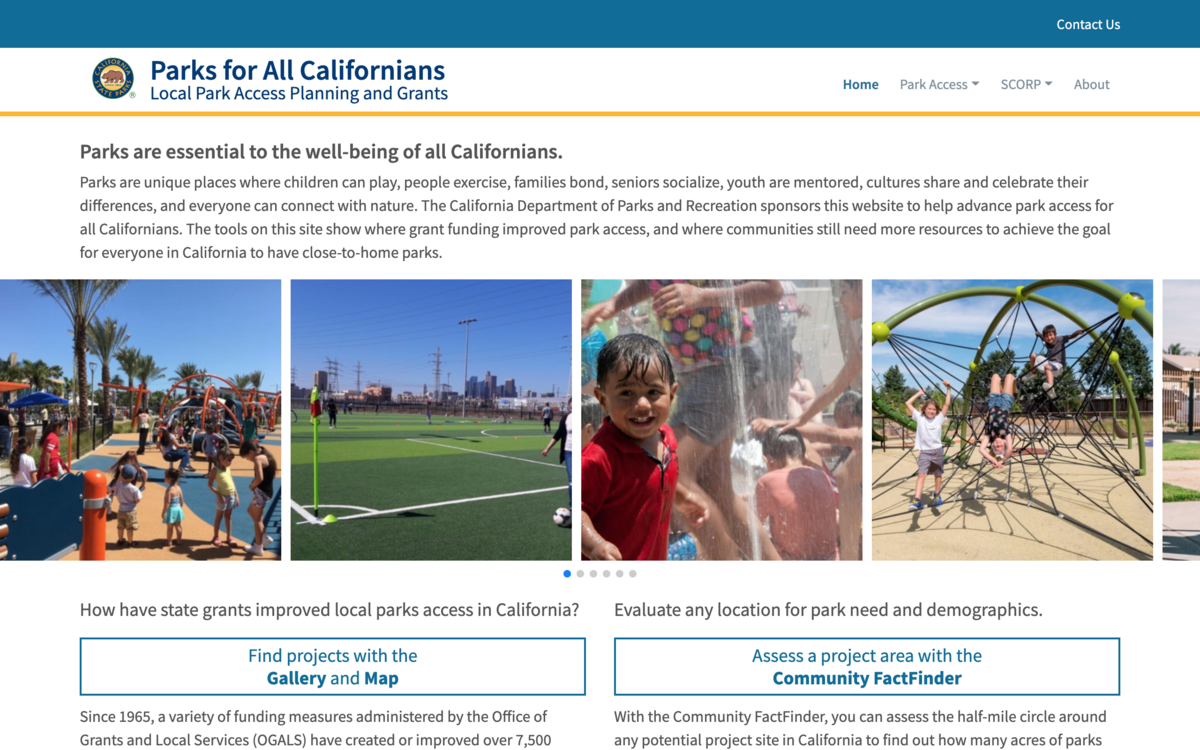
Parksforcalifornia.org is the online home of the latest implementation of the data, tools, and methods described in this report.
After exploring the history and evolution of the data, tools, and methods, be sure to try them out for yourself at parksforcalifornia.org
Agencies and advocates across California are increasingly committed to ensuring that every Californian has equitable access to high-quality parks, regardless of age, income, ethnicity, or other indicators of social inequity. In 2015, State Parks launched the nation's first interactive web application that identifies park-deficient neighborhoods throughout the entire state.
With common baseline data accessible to anyone with a web browser, California's grant programs have been able to make a data-driven system to support the creation of parks and new recreation opportunities in park-deficient communities.1
Today, State Parks continues its commitment to using data and analysis to equitably distribute grant funding for local parks in communities statewide. Using open source web technology for park-access and demographics can help inform objective decisions in both local park planning and statewide analysis of proposed grant projects.
This report details the data and analytical approaches State Parks has used to understand where local parks are needed.
Over the past decade, improved data availability and open source web technology have made it possible to create a common, easy-to-access reference point to help inform decisions about where to locate projects.
The most important outcome of the work described in this document is the multiyear use of the Community FactFinder tool (parksforcalifornia.org/communities ), across several bond acts and over $7 billion in grant requests, leading to new park access for hundreds of communities statewide.
1California's 2015–2020 SCORP found that people most often access parks closest to their home. Easy access to parks improves quality of life and a wide range of health and wellbeing outcomes. People need the time and financial resources to travel to parks away from their communities.


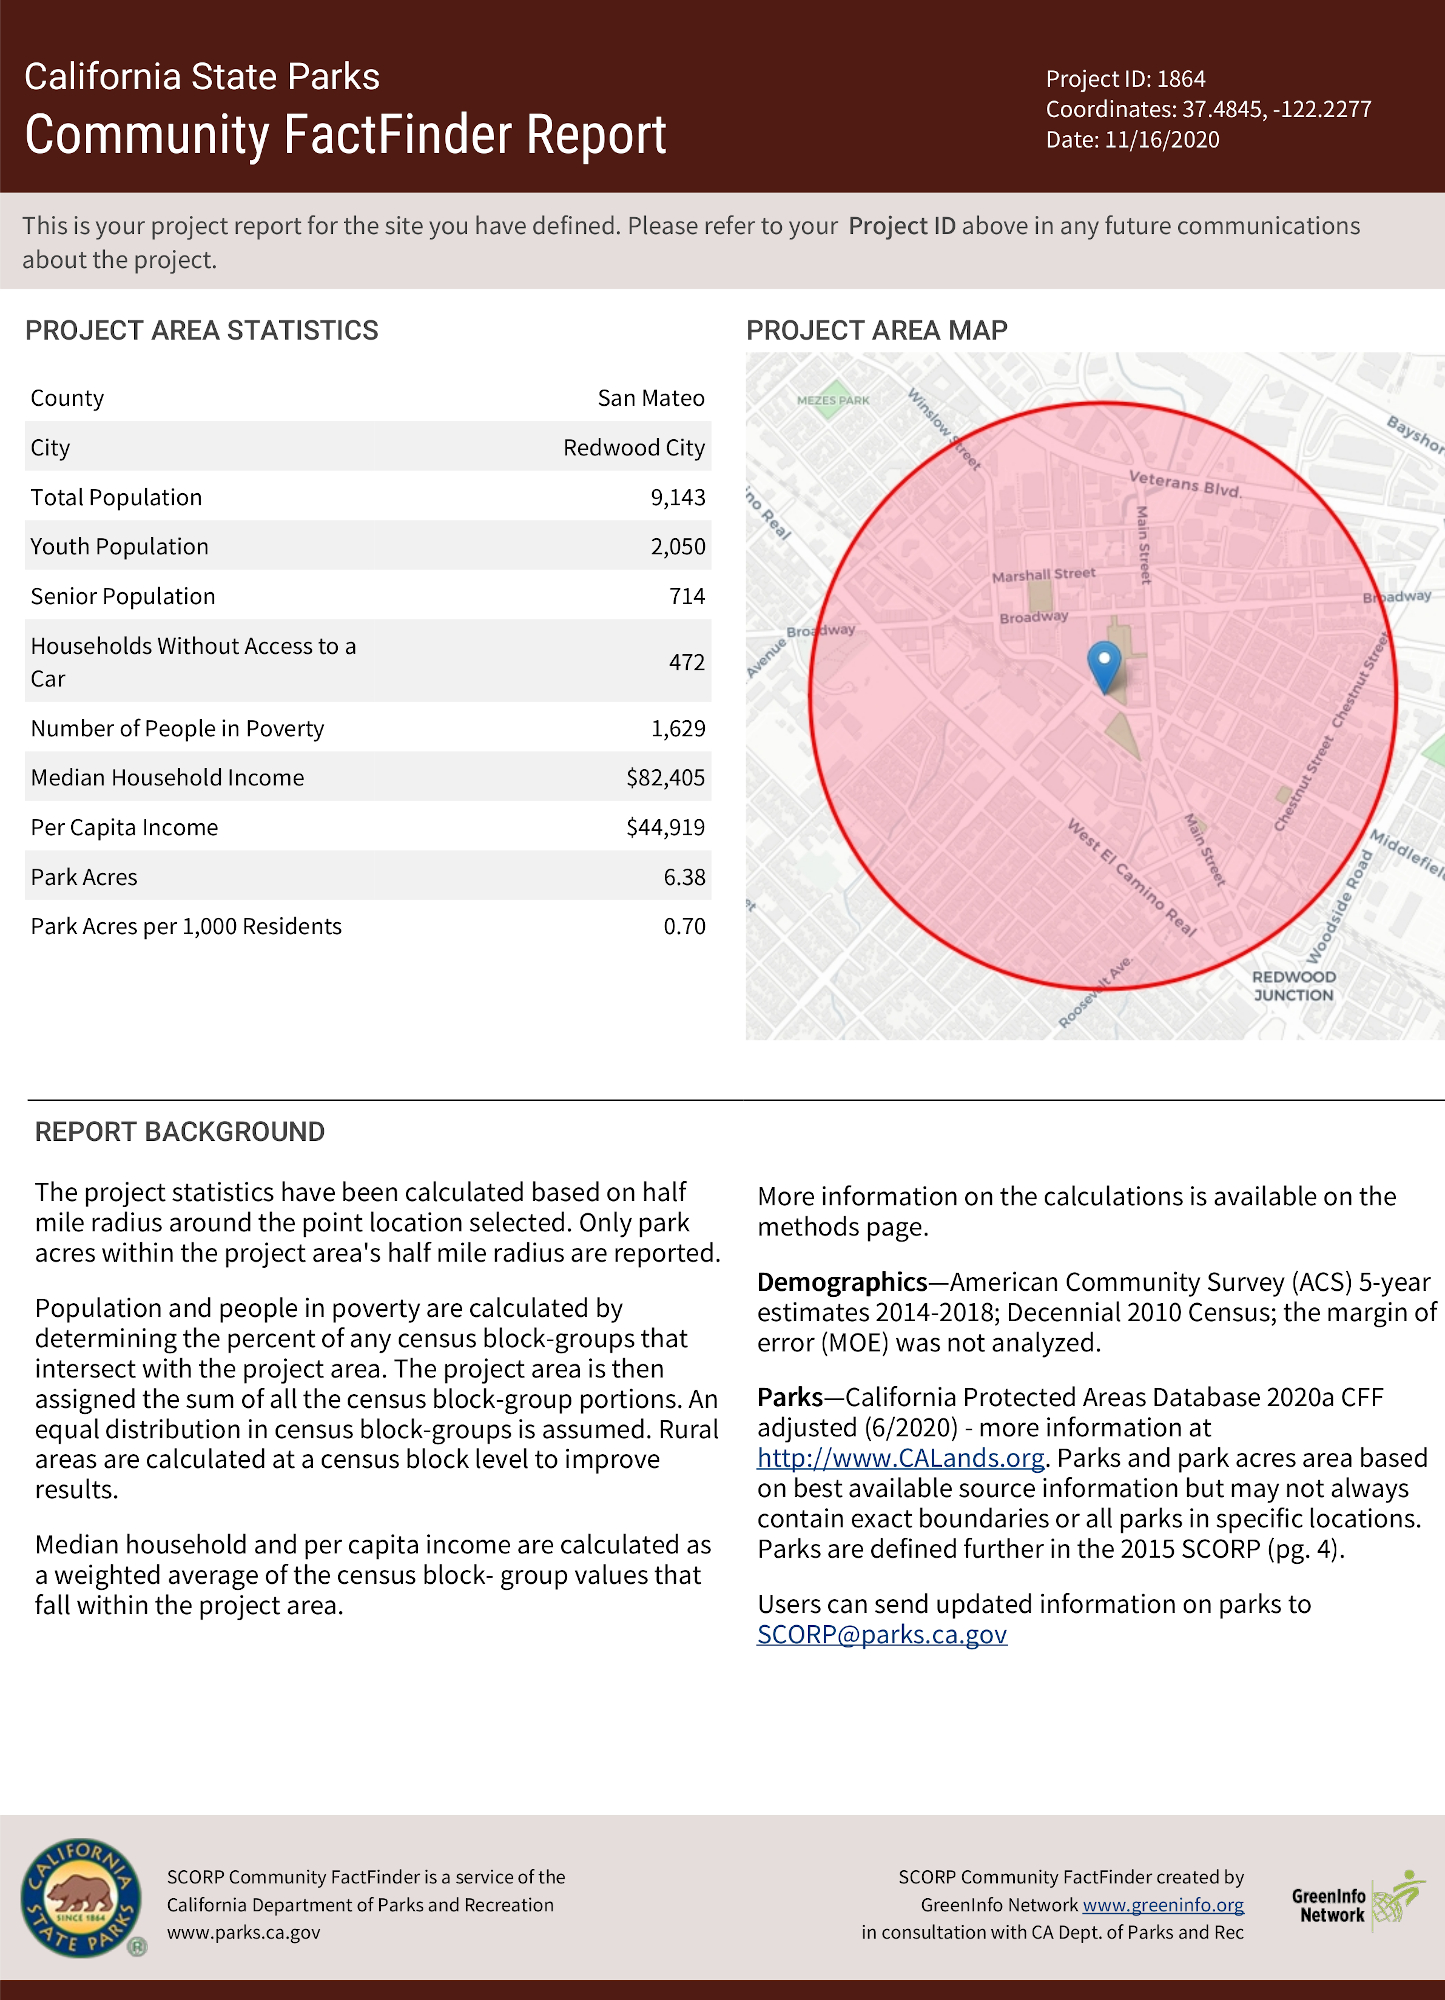
The Community FactFinder tool provides a critical service: Statistics on park presence/absence and the demographics near any potential project area in California. The data from this tool is:
- Accessible through a website with no login or other barriers.
- Uniform, current, documented, and specific, providing base data about populations and parks.
Behind the Community FactFinder tool is over a decade of ongoing innovation and improvements to develop the technical, policy, and human capacities needed to generate statewide park and demographic data for all proposed project sites.
This report highlights the legacy of California's innovation.

Funding
- 2000: Prop 12
- 2002: Prop 40
- 2006: Prop 84
- 2008: AB31
- 2018: Prop 68
Demographics
- 2000: Census Conducted
- 2000-2009: Demographics data purchased from third party vendors
- 2001-2003: 2000 Census Data Released
- 2005: American Community Survey (ACS) begins data collection
- 2010-Today: Annual ACS Five-Year Releases
Parks
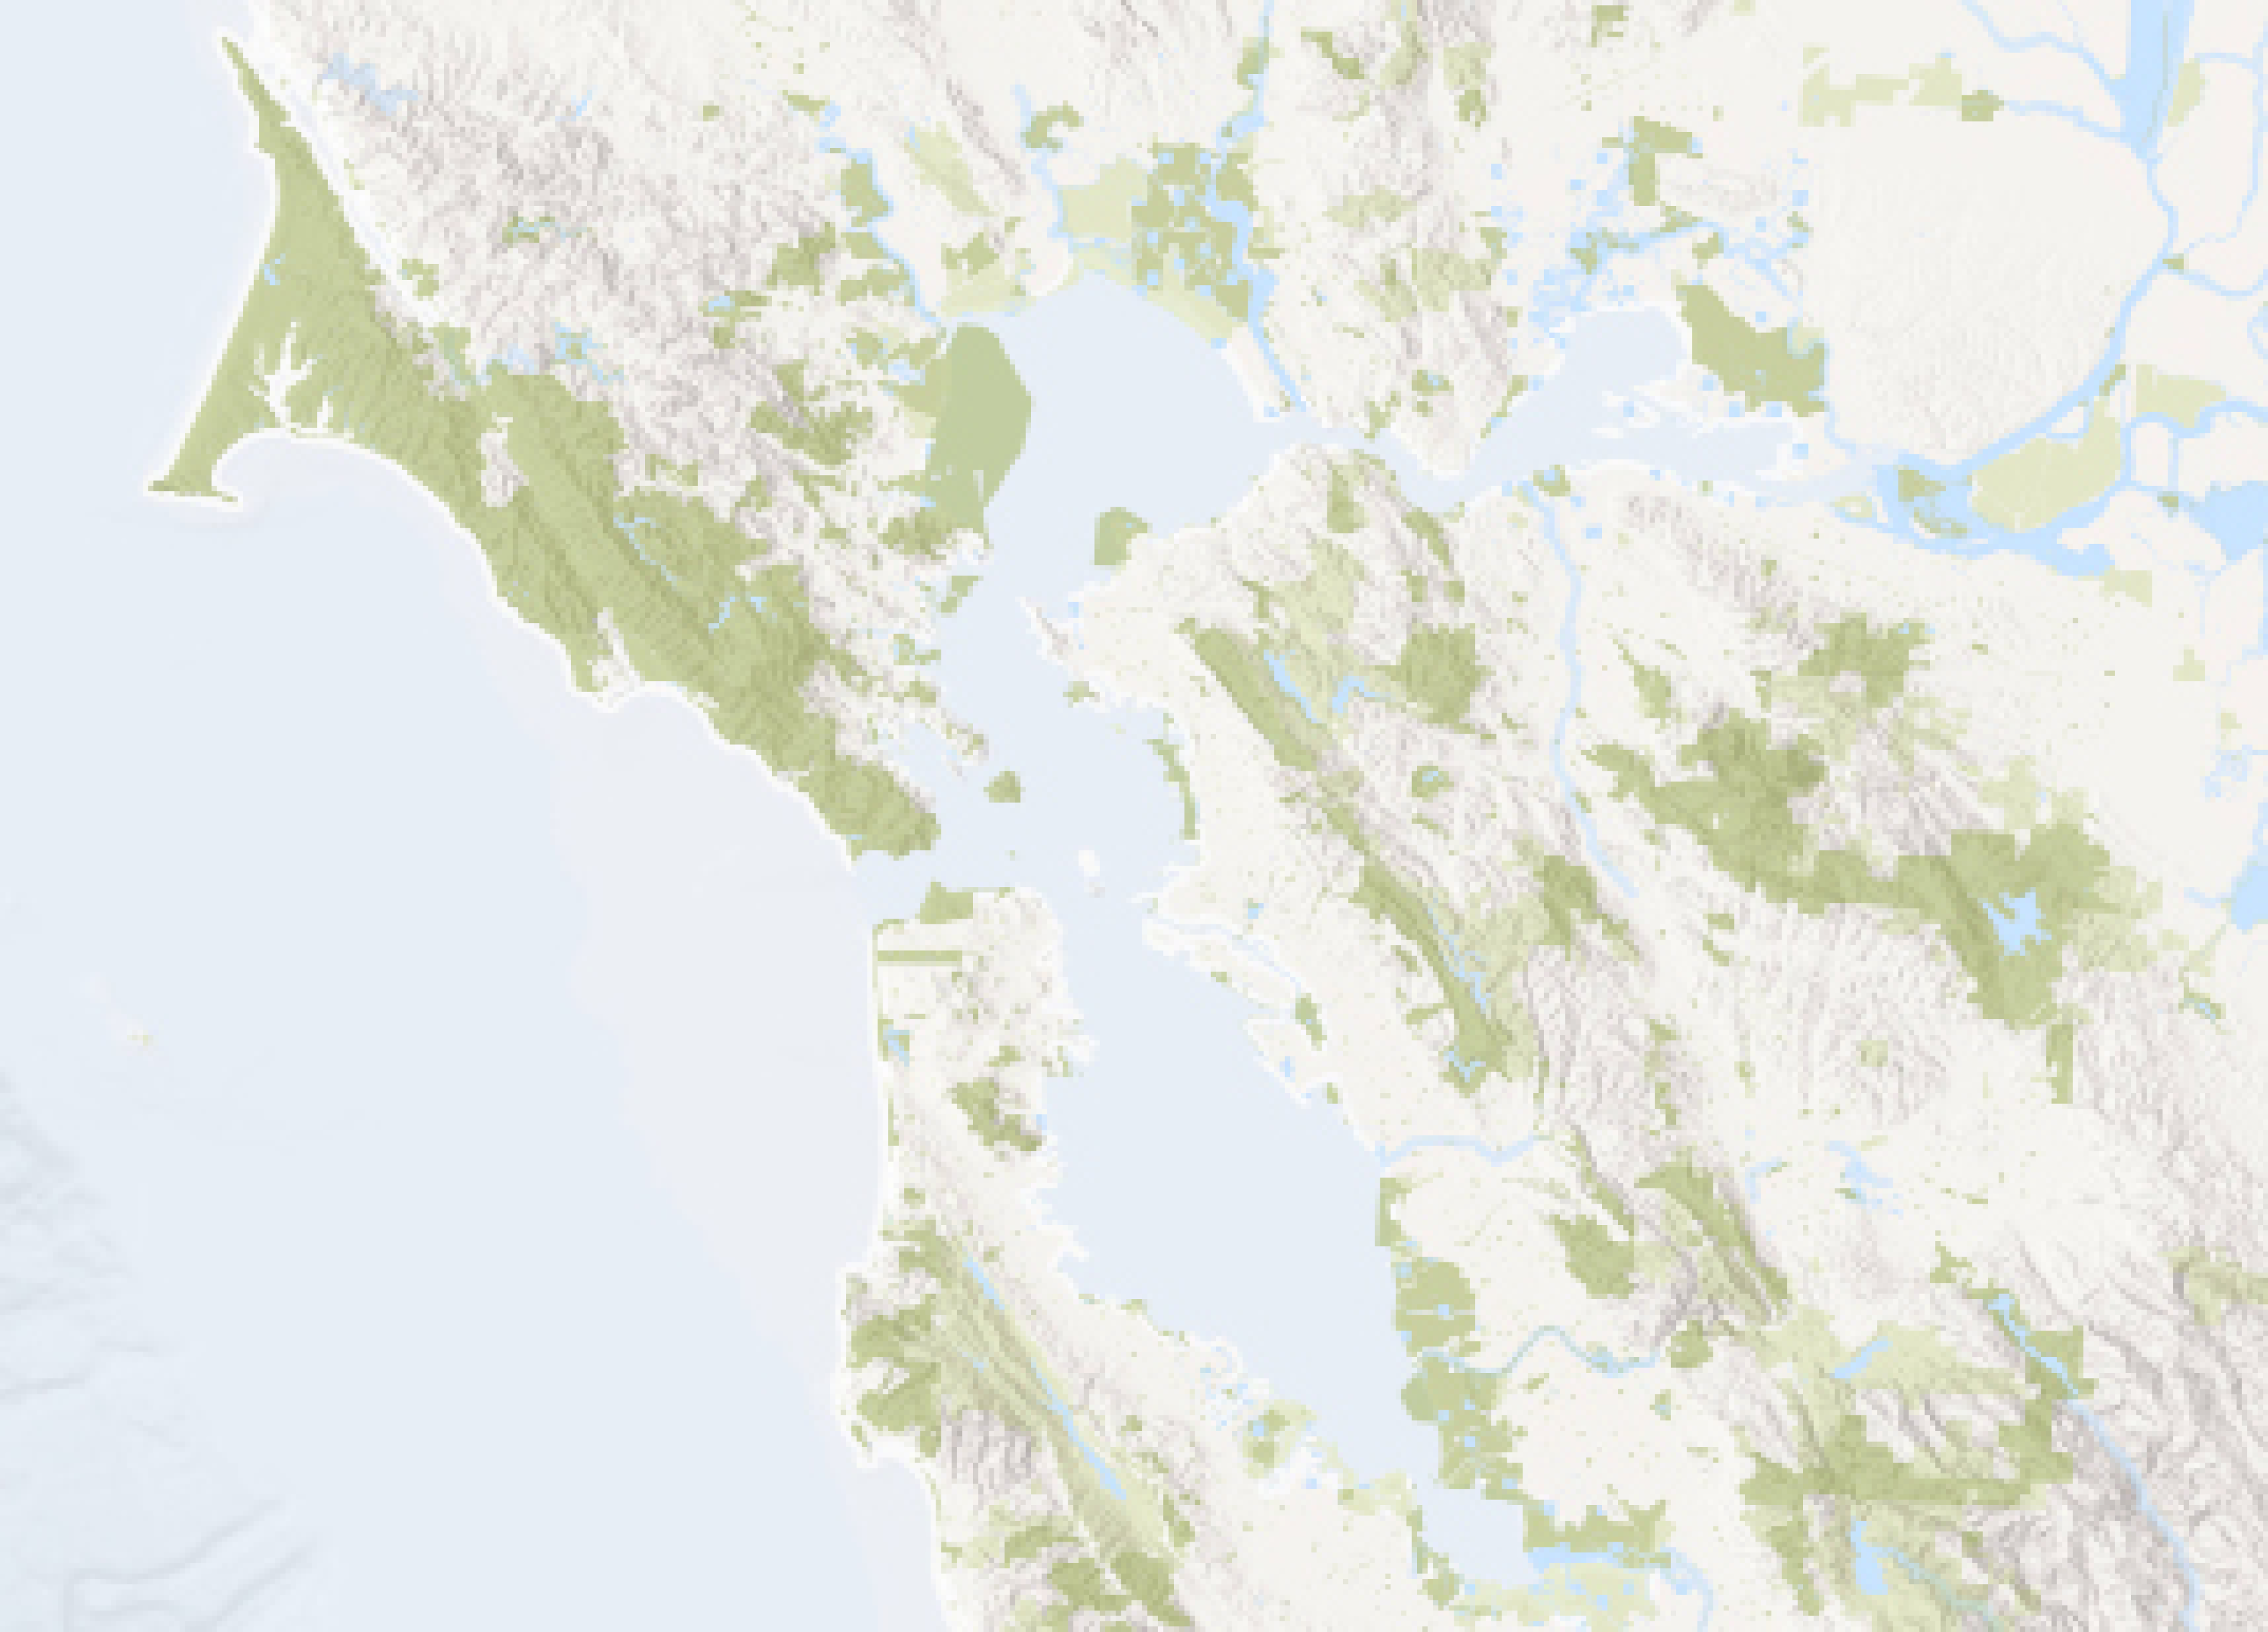
- 2002: Bay Area Protected Areas Database (CA's first regional database)
- 2003-2006: Public and Conservation Trust Land Releases
- 2006-2009: Regional Databases for all of California
- 2009-Today: California Protected Areas Database Annual Releases
Synthesis
- 2008: Community FactFinder Introduced
- 2009: Community FactFinder State Parks Program Round 1
- 2011: Community FactFinder State Parks Program Round 2
- 2015: SCORP 2015 Park access measures introduced
- 2019: Community FactFinder State Parks Program Round 3
- 2020: Community FactFinder State Parks Program Round 4 and 2020 park access measures introduced
- 2025: SCORP 2025 Park access measures introduced
Californians have a history of supporting parks funding. Over the past 20 years, California has made significant improvements in using spatial and demographic data to measure park acreage in relation to where people live at the community and even neighborhood level.
Propositions 12 (2000) and 40 (2002)
Propositions 12 (2000) and 40 (2002) marked a substantial increase in bond funding for parks and environmental preservation within the state of California. Over the previous 24 years (1975 to 1999), state voters had approved just under $2 billion in bonds for natural resource protection and parks (according to Ballotopedia). Proposition 12 (2000 Bond Act) authorized $2.1 billion for natural resources, neighborhood parks, and water quality grant programs, and Proposition 40 (2002 Bond Act) provided another $2.6 billion in bond authorization for similar programs, with an emphasis on local parks and coastal protection.
In the early 2000s, these bond acts passed when the use of geospatial data was still uncommon in policymaking. Some of the grant programs began to require an analysis of which communities lacked parks and were affected by poverty.
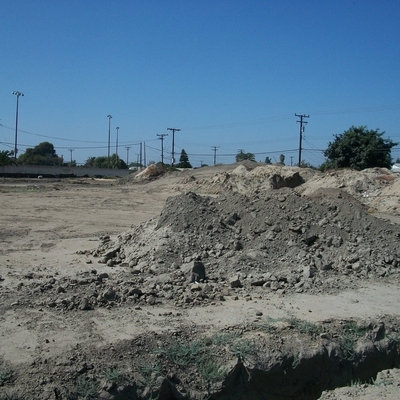
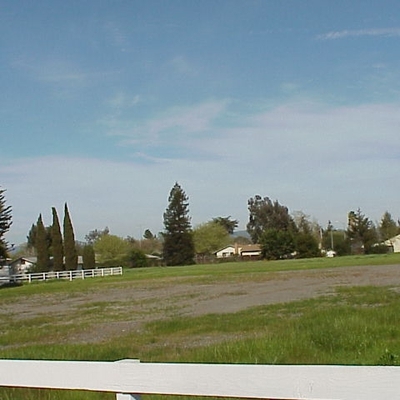
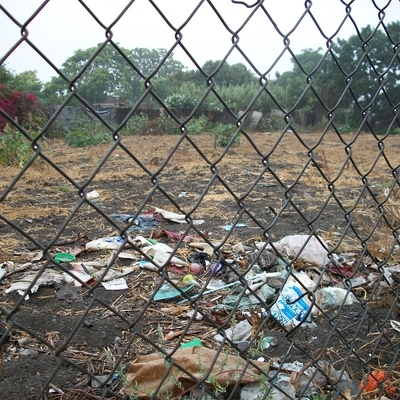
For example, Proposition 12/2000 Bond Act's Murray-Hayden Urban Parks and Youth Services grant program prioritized projects by the following:
"...within the immediate proximity of a neighborhood identified by the department as having a critical lack of park or open space lands or deteriorated park facilities, that are in an area of significant poverty and unemployment, and that have a shortage of services for youth."
This legislative direction required State Parks to create a grant proposal system that identifies which competing project areas are located in "immediate proximity of a neighborhood" with a "critical lack of parks" and "significant poverty." However, a statewide tool to calculate the data for all applicants to allow for a consistent analysis was not available:
- Statewide park acreage data for all neighborhood, community, city, regional, state, and federal parks was not easily available in any format 20 years ago.
- Demographic data was available, but hard to work with due to technological limitations twenty years ago.
- Local jurisdictions did not use or have standard metrics that would provide a consistent methodology for local agencies to use in determining need.
Grant applicants were required to perform substantial research, including demographic and park acreage calculations, estimate the population, income, and park acreage, within a consistent radius of each competitive project site. Applicants had to determine what Census Tracts were within the radius and try to calculate the total population and income for that area. Then applicants had to go to local park agencies and ask for the park acreage of various parks found within the area. This involved going to multiple data sources, performing multi-layer research, and conducting calculations manually which is both less accurate, less consistent, and challenging to verify.

Proposition 84 (2006) and Assembly Bill 31 (2008) Starts the Statewide Park Program
In 2006, voters passed The Safe Drinking Water, Water Quality and Supply, Flood Control, River and Coastal Protection Bond Act (Proposition 84). Proposition 84 authorized $5.4 billion in bonds to fund safe drinking water, water quality and supply, flood control, waterway and natural resource protection, water pollution and contamination control, state and local park improvements, public access to natural resources, and water conservation efforts.
In 2008, California's Legislature approved the Statewide Park Development and Community Revitalization Act (Assembly Bill 31 — also known as AB 31), which set measurable and specific goals for funding park projects in underserved communities. OGALS within State Parks was tasked with distributing park bond funds, according to defined criteria from AB 31:
"The term 'critically underserved community' would replace the term 'heavily urbanized county' for purposes of the act and would be defined to include a community with less than 3 acres of usable parkland per 1,000 residents or a disadvantaged community, as defined, that can demonstrate to the Department of Parks and Recreation that the community has insufficient or no park space and recreation facilities."— from the text of AB 31
AB 31 marked a major milestone in the vision for equity in funding. It set the standard for measuring equity by requiring one of these to be true:
- Does this area have a demonstrated shortage of park access? The standard baseline is a ratio of 3 acres of parkland per 1,000 residents.
OR
- Is the community disadvantaged? The standard baseline is a median household income of less than 80% of the statewide average.
To implement these two legislated metrics, OGALS sought standard data within a half-mile of each proposed project area. The half-mile metric is based on studies showing that people use parks most when those parks are easy to access. Traveling a half-mile or less, without needing a car or public transportation, is a sure way to encourage projects that deliver close-to-home park access. By using standard data to rank the ratio of park acres per 1,000 residents and median household income of all competing project areas, communities with the lowest park acreage and lowest incomes would have a competitive funding priority.
Fortunately, data and innovation of web-based "Geospatial Information Systems" (GIS) had evolved significantly since the early 2000s:
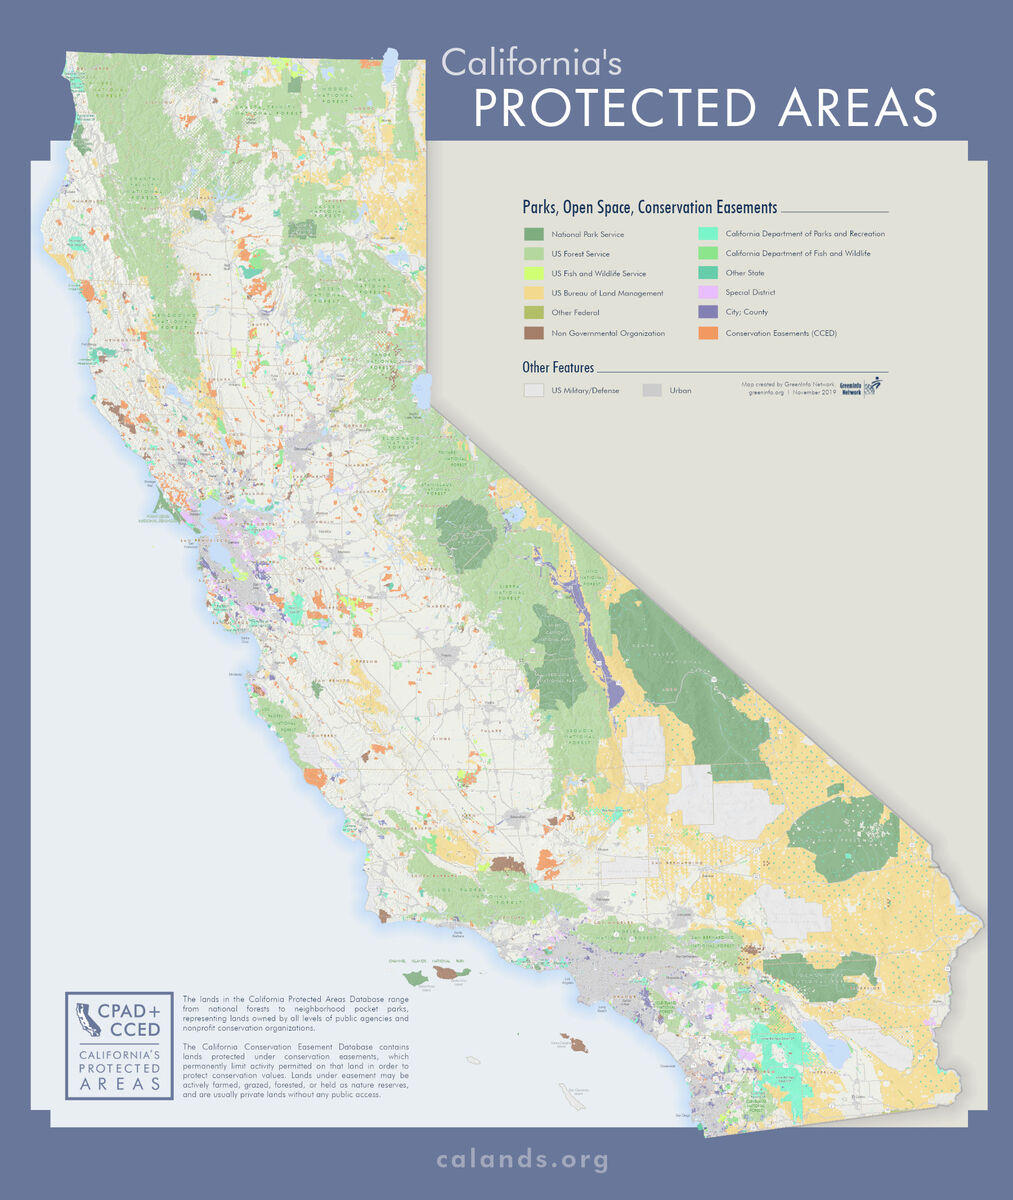
- Close to the passage of the Prop. 84/2006 Bond Act, GreenInfo Network and State Parks worked together to create and launch the first version of the California Protected Areas Database (CPAD).2
- When OGALS saw GreenInfo present CPAD in 2006, this new resource was adopted as key to make park acreage data easily accessible for all statewide applicants.
- OGALS asked Greeninfo if a web-based tool could be created to calculate demographic data along with CPAD park data within a half mile radius of any potential project site in California. This collaboration led to the creation of the Community FactFinder.
The era of manually calculating demographics and acreages came to an end when OGALS saw that a GIS web-based tool could be designed to report consistent and accessible park and demographic data for all potential project sites in California.
The Community FactFinder was also designed to help applicants search their jurisdiction for park-poor or economically disadvantaged communities. And, the web-based tool was envisioned to be free of charge for anyone to use.
The web interface enabled users to find a project site by an address or moving the half mile radius pin throughout a community looking for underserved areas. When a site was selected, applicants generated a project area report with a quick click. The report showed park acres per 1,000 residents and Census-based demographics in that radius. Grant applicants submitted these to State Parks in their grant applications.
The result was a process where everyone had access to the same statistics and mapping tools, ensuring that GIS capacity was not a factor for grant applicants. OGALS performed intense reviews of all park data within thousands of proposed project areas' half-mile radiuses. In cases where applicants identified missing or incorrect data in CPAD or issues with Census data, OGALS worked closely with grant applicants to ground truth and evaluate the data. At times this resulted in updates to CPAD park data to ensure an up-to-date inventory.
This technical assistance tool helped lead to an unprecedented volume of grant requests. OGALS received $2.9 billion in requests through 900 applications during two competitive rounds of the Proposition 84 Statewide Park Development and Community Revitalization Program (Assembly Bill 31). The $2.9 billion in requests competed for $368 million of Proposition 84 funding. Over 100 new parks were created and 20 existing parks were improved statewide through the Statewide Park Program (SPP) Rounds One and Two.
2 A state-supported, multi-jurisdiction protected areas dataset developed by GreenInfo Network over many years.
See more at calands.org .
Proposition 68 (2018) Continues the Statewide Park Program
In 2018, voters passed Proposition 68, which authorized $4 billion in bonds for state and local parks, and other environmental protection, restoration, water infrastructure, and flood protection projects.
Proposition 68 required that 20% of bond funds go to projects in communities with median household incomes less than 60% of the statewide average (Severely Disadvantaged Communities).
The legacy of the State Parks Development and Community Revitalization Program was continued through Proposition 68, making $650.2 million available to create and improve park access in underserved communities. The $650.2 million will be awarded through two competitive "rounds" (Rounds 3 and 4) of funding.
On August 5, 2019, State Park's OGALS received $2.3 billion in requests for $254.9 million available in what is called SPP Round 3. Round 3 awarded 62 new grants. An additional $395.3 million will be available for SPP Round 4, with a March 12, 2021 application deadline.
California Protected Areas Database
Brief History
In the early 2000s, the State of California developed an initial statewide coverage of protected lands known as the Public and Conservation Trust Lands (PCTL) database. This data included mainly state and federal lands owned in fee (with some other lands included) and was developed through a consortium of these agencies (last updated in 2005). PCTL, however, did not encompass all regional and local land holdings and it is now a legacy data set, replaced by the California Protected Areas Database (CPAD).
Regional Databases
People in some better-resourced parts of the state developed their own regional data sets, most notably the Bay Area Protected Areas Database (BPAD) in the early to mid-2000s. This was funded by region with various foundations/agencies helping to build the base, but that also meant highly variable coverage across the state. These were the first standardized efforts to collect more data on regional, local, and nonprofit-held lands.
CPAD — Full state Database
With the release of Version 1 in 2008, eight regional databases were stitched into one, with data schemas unified and file size managed to allow for a single, wall-to-wall database for the first time.
Since that first release, CPAD has benefited from steady progress and improvements in both data and technology. Though there have been gaps, funding for CPAD has been relatively stable over the years, allowing GreenInfo Network to build a strong foundation in database structure, automation, quality control, user base, and connections to data contributors. That institutional knowledge also makes it easier to adapt to periods of low to moderate funding.
California has the nation's largest population and third-largest land area. Measuring park access across California is complex — comparing the intersection of land data and demographic data requires constant inventory updates to accurately detail parcels of land for more than 14,000 parks in relation to where people live.
The two critical inputs to this work are the U.S. Census3 and CPAD. Together these identify demographic data and which lands are protected and accessible as public parks.
To assess the ratio of park acreage per 1,000 residents at any location in California, State Parks must have an accurate picture of what parks exist in that area. Until the mid-2000s, comprehensive data on parks and open space simply did not exist for most of the state. While individual agencies often had data for their own lands, no one had taken on the task of collecting that data from the more than 1,000 agencies that own and manage over 14,000 protected areas in California.
The Complexity of Defining "Parks" for the special use of grant programs
Developing the statewide CPAD, and then using it for the SPP, required OGALS to develop standards on:
- What is a park?While identifying park acreage boundaries are obvious in some cases, there are many less obvious cases. Clearly defined standards help differentiate government plots such as libraries, courthouses, and city halls in or adjacent to what may appear to be park space, bikeways along channels, schoolyards, nonprofit recreation sites such as a Boys and Girls Club, and sites that offer only indoor recreation centers that are not in a park but operated by a local park agency. These are some examples of what one agency may consider as land that should be counted towards park acreage, while another agency may not.
- What information do we track about a park?Every agency tracks different information about the land they define as parks, from the minimal boundary and name to extensive attributes that provide detailed information on amenities. A statewide database must find the smallest array of baseline attributes to meet the analytical needs across thousands of parks.
- What open space areas should be included in the California Protected Area Database but tracked differently than a "park," and why? Some wildlife preserves and Bureau of Land Management (BLM) properties, for example, are protected open space areas but may have no recreational access or only "restricted" public recreational access including special permits required to enter the public agency property. Other forests, BLM, and protected open space areas have a trail or other designated public recreation facility where the public can experience nature.
Categorizing over 14,000 open space areas in CPAD to determine which should be captured as public recreation acreage required a category label of land in CPAD.
For the Community FactFinder tool, experiences of OGALS staff through the SPP Rounds 1 and 2 (under Proposition 84) and Round 3 (Proposition 68) involved categorizing the following complex scenarios in CPAD.
In each of the examples below, OGALS developed guiding principles of what should and should not be counted as a park in the Community FactFinder.
Restricted Access: These lands are open space preserves owned by public agencies but generally are nature preserves that are only open to the public through special permits. All of these types of lands are included in CPAD but not counted toward park acreages for the purpose of the Community FactFinder.
Resolution:
Land excluded from the Community FactFinder:
- Land that does not have a designated recreation facility and are isolated as non-contiguous parcels from adjacent recreation areas (remote and inaccessible patchwork lands, typically isolated BLM parcels).
- Wildlife preserves that require a special permit to access.
Land included in the Community FactFinder:
- Open space land that is part of a larger contiguous area offering formal designated public recreation such as recreational trails or campground areas.
Mixed-Use: Suburban communities often use large government plots to locate groups of non-park services with park services. These can include a library, courthouse, or a city hall, adjacent to park space. The standard practice of using parcel boundaries for the entire government plot in these cases would lead to overestimating the acreage of actual park space.
Resolution:
- In most cases aerial and street view imagery help define the boundaries of the park space compared to the library, courthouse, city hall, etc. If the non-recreational sections are small and embedded in the park, they are included. When large and distinct sections are identifiable (such as a library), they are removed.
Schools: School grounds can offer recreational resources to a community when official joint-use agreements allow the public access during non-school hours. However, when should a school property be counted as an actual park? In rare cases, there are long-term joint-use agreements for school district property operated by a local park agency with park signage and a publicly recognized park name. In other cases, there are joint-use agreements only approved on a year-to-year basis to help school districts maintain flexibility to build more classroom space if needed. In rare cases, schools that have been permanently closed may present potential sites for new parkland in dense communities with little to no available open space. It is important to realize that not all schools should be counted by the Community FactFinder as parks, since that would lead to an inaccurate representation of the community's actual park acreage.
Resolution:
- To be considered a public park, the school district land must have an official multi-year joint-use agreement along with public park signage identifying the land as a park, or listing on a local city/community/county website as a public park resource. Additionally, school lands where park grant funds have been invested are included in the Community FactFinder.
Cemeteries: CPAD considers historic cemeteries to be public protected areas when they are operated by a public agency. However, for the purpose of the Community FactFinder and the SPP, cemeteries are not counted towards a community's park acreage. All historic cemeteries captured in CPAD are removed from the Community FactFinder.
Trail Corridors: These present perhaps the most complex example of when to consider a linear corridor area as a park. Many corridors function as a means of transportation between locations (for non-motorized travel). Some are a mix of transportation and a few park-type amenities (benches, fitness stops, playgrounds, or restrooms).
Resolution:
- Because of the complex nature of corridors, each is reviewed individually. Given the nuance and complexity around these lands, State Parks often contacts local agencies for their help in determining if the land is locally considered a linear park or is primarily a Class I, II, III, IV bikeway not considered a linear park.
The five examples above help explain complexities of reporting and measuring a community's actual park acreage. These fine-grained control layers over the statewide foundation of CPAD allow OGALS to present an impressively detailed and accurate picture of recreation lands across the entire state of California for the purpose of the SPP and Community FactFinder.
Demographic data is available in various formats and levels of detail from the U.S. Census Bureau. To measure park access, the value of detailed demographics and parks data is achieved through a nuanced approach.
From 1990 to the early 2000s, demographic data was available only from the Decennial Census. The Decennial Census is meant to be as close to a true count of the population as possible on one day (April 1st).
Pros:
- Data for the main variables come directly from the forms all residents complete.
- More detailed data comes from the long-form sample (roughly 1 in 6 households) and is estimated for the remainder of the population.
- Recognized and authoritative source for local, state, and federal funding allocations
- Available nationwide at a variety of geographic levels.
- Can be joined to geographic TIGER files (tracts, block groups, counties, etc) for spatial analysis.
Cons:
- 10-year gap between data leads to significant changes on the ground between updates.
- After the 2000 decennial census, the long form was discontinued. Income data was not available in 2010, nor is it anticipated to be collected in future decennial census efforts.
- Significant effort required to obtain and process demographic data.
- Significant effort required to join the tabular and spatial data.
Commercial providers (such as Claritas and Geolytics) had population projections available for purchase between Census releases, which helped bridge the frequency challenge, but only at a cost.
In 2008, the Census Bureau released the first American Community Survey (ACS) multiyear estimates, and it has continued releasing annual updates to single and multi-year population estimates in the years since. The ACS provides key data estimates in the years between the Decennial Census, and also takes the place of the long-form census questionnaire, which has been discontinued from the Decennial Census since 2010. Unlike the Decennial Census, which is a full population count, the ACS is an estimate based on sampling that is ongoing.
Pros:
- Rolling five-year data is released every year.
- Provides income data post 2000.
- Recognized and authoritative source of information.
- Available nationwide at a variety of geographic levels.
- Comes with data pre-joined to TIGER files4, making updates quick and easier.
Cons:
- Estimates are less accurate than what new decennial census data could provide. However, decennial census data was last completed twenty years ago and is no longer reliable.
- Because ACS uses surveys and estimates rather than full counts, the margins of error are high in some areas and for some variables. However, in most places, the benefits of recency outweigh issues with margin of error, and where that is not the case, custom analysis can be conducted to review available data and ensure a balanced outcome.
The Community FactFinder and other related tools today rely on the ACS for its demographics data. To further refine rural communities, decennial block data are used to more accurately distribute population figures.4
4 Methods for downsampling of data from block-group to blocks in rural areas: parksforcalifornia.org/methods
(Section: Community FactFinder)
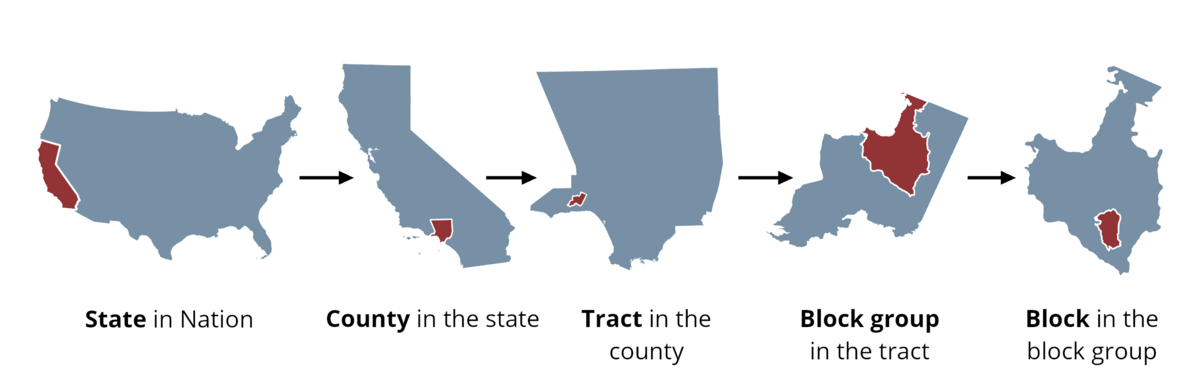
Census data comes at multiple spatial resolutions:
Census Tract
Census Tracts are relatively permanent statistical subdivisions of a county, with an average of 4,000 residents, and are a collection of block-groups. Tracts are designed to be homogeneous with respect to demographic and economic conditions and vary greatly in spatial size.
Census Block Group
A census block-group is a collection of about 40 blocks and has an average of 1,500 residents. Block-group is the smallest geography for which the bureau publishes data on poverty, median household income, and other sample data attributes. Block-groups do not cross state or county lines.
Census Block
A census block5 is the smallest geographic unit used by the US Census Bureau for the tabulation of data. They are formed using physical, cultural, and legal boundaries such as rivers, roads, and jurisdictional boundaries. Blocks vary greatly in population size.
This illustration shows how Census geographies fit inside the more familiar contact of counties and state boundaries:
Beyond these core shapes, the Census publishes data on a wide array of other geographic units, such as Census Designated Places and Public Use Microdata Areas (PUMA), which attempt to bridge the gap between the Census's core geometries that emphasize comparability (block to block, tract to tract) and how we define places every day (my town, this city, that neighborhood).
Currently, block-group data is used for Community FactFinder project-location analysis, with rural areas further refined through the use of block level distributions.
5This report covers the definition and history of Blocks and Block Groups: www2.census.gov/geo/pdfs/reference/
The true value of detailed demographics and parks data comes when State Parks combines the two sources to assess any potential project area in the state.
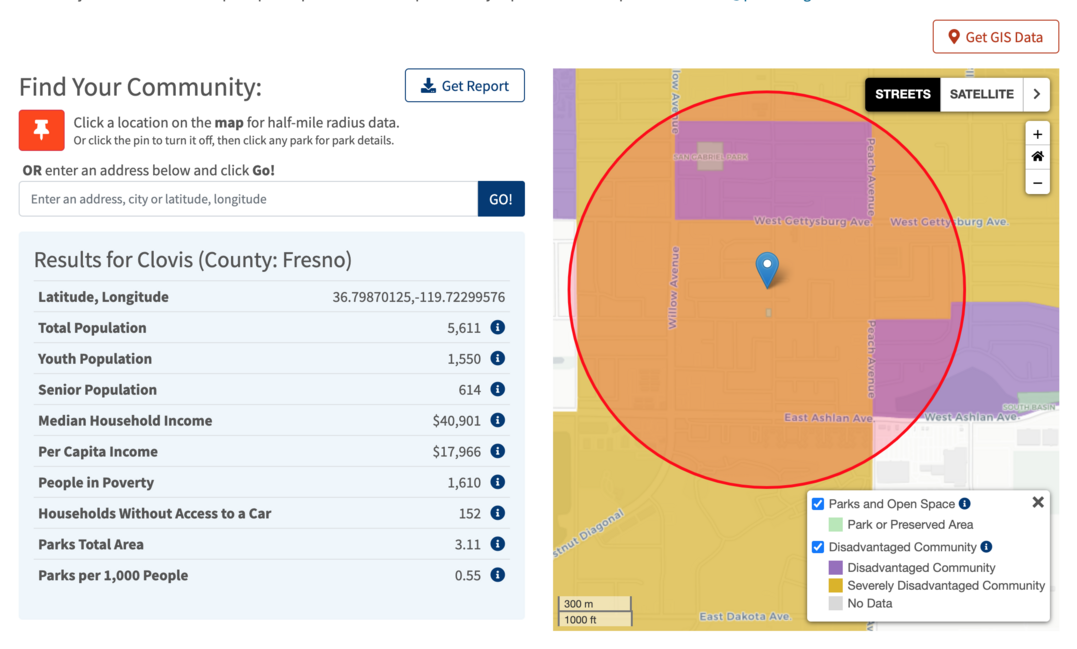
Community FactFinder
To better capture that on-the-ground reality, we have developed the Community FactFinder tool (parksforcalifornia.org/communities). This tool uses the location of a proposed project to create a half-mile radius circle and proportionally calculate the results for the people who live in that circle, regardless of how closely Census geometries or park boundaries match that circle.
At this site-specific level, State Parks calculates "Park Acres per 1,000 Residents" along with median household income, per capita income, and population overall, of youth, of seniors, people in poverty, and households without car access.
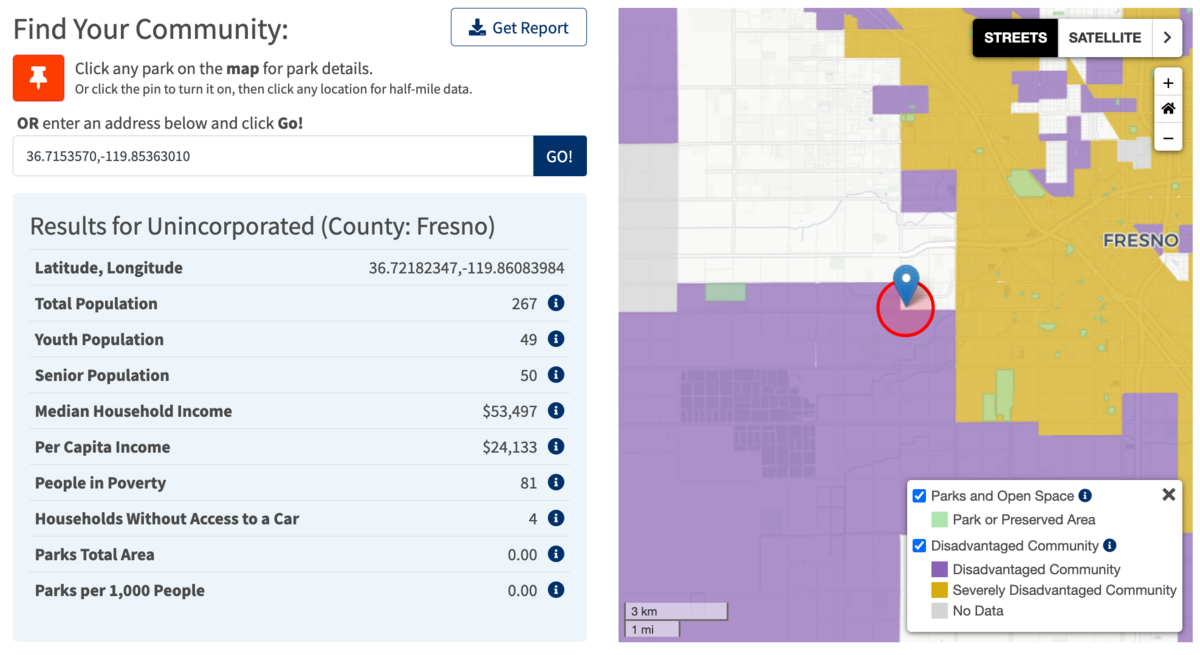
As shown in the example map below, a location can be outside of a Disadvantaged Community according to Census geometry, while actually having areas that are both Disadvantaged and Severely Disadvantaged within a half mile. The Community FactFinder achieves a more accurate picture by calculating income, population, and park data relative to the actual project location's radius.
While the use and ranking of consistent data to measure park deficiency and poverty is extremely valuable to help prioritize projects, any competitive grant review process should also include analysis and professional judgement of other factors of need and project benefits.
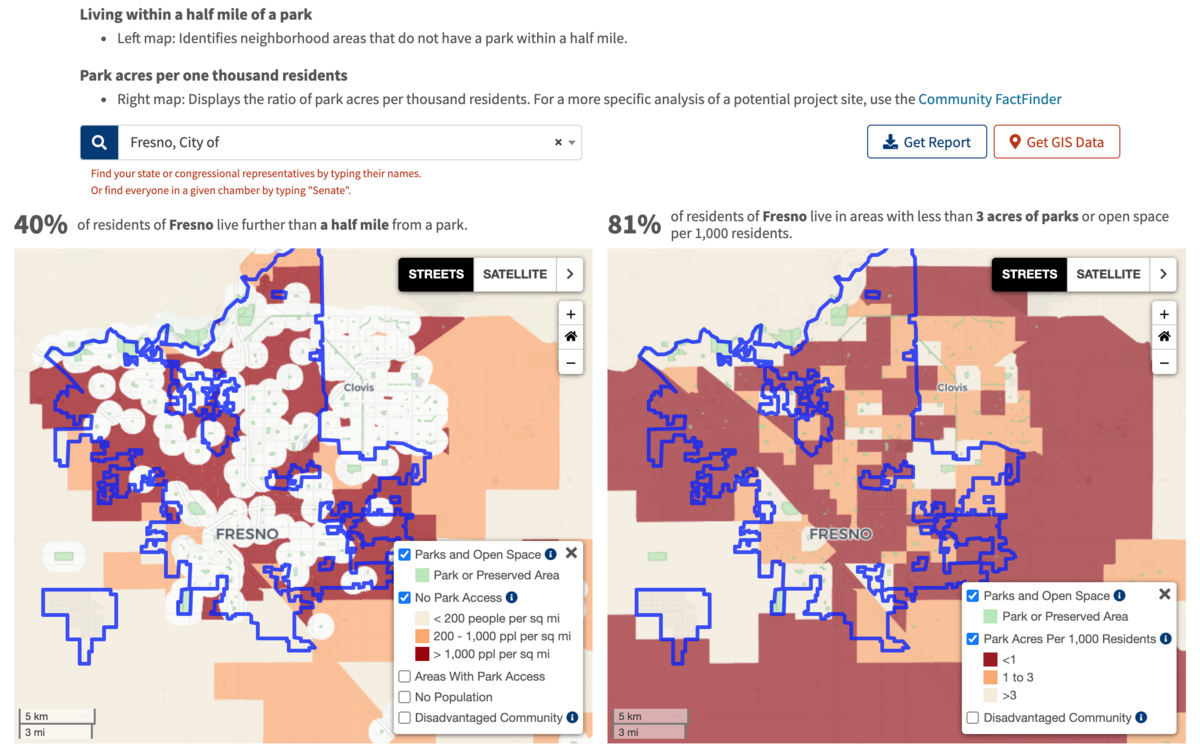
Park Access Tool
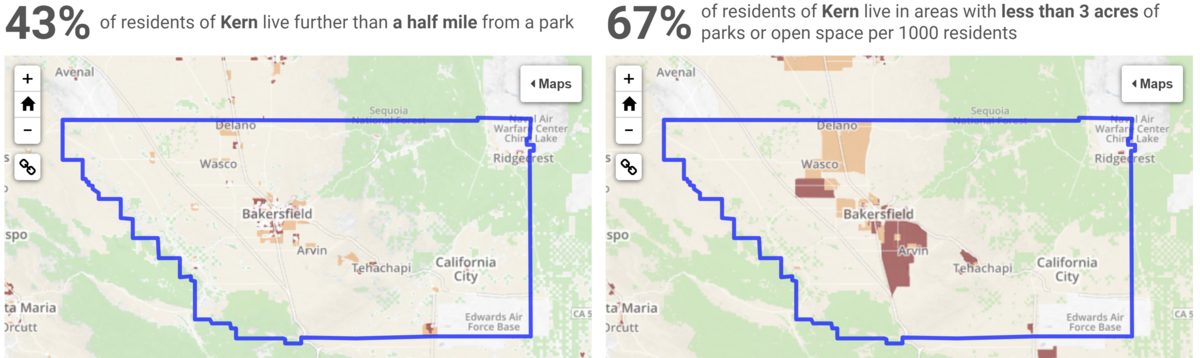
State Parks also conducted a broader analysis at larger geographic scales to calculate not only park acres per thousand people but also the percentage of people who live within a half-mile of a park. As presented in the Park Access Tool (parksforcalifornia.org/parkaccess ), State Parks has calculated these statistics for cities, counties, and legislative districts to allow lawmakers and government staff to understand how their communities fit within the larger picture of park access in California:
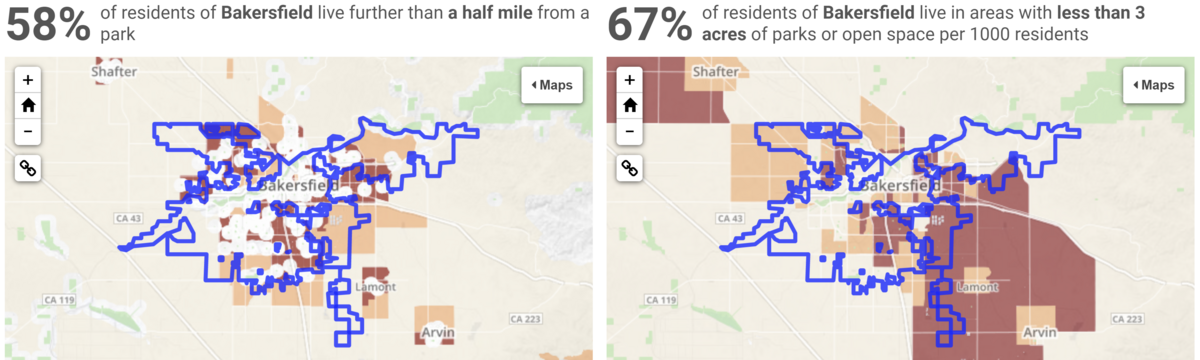
Bakersfield, Kern County Statistics
- 58% of residents of Bakersfield live further than a half mile from a park
- 67% of residents of Bakersfield live in areas with less than 3 acres of parks or open space per 1000 residents
- 43% of residents of Kern live further than a half mile from a park
- 67% of residents of Kern live in areas with less than 3 acres of parks or open space per 1000 residents
In 2015, when we first launched these tools, we found:
- 62% of Californians lived in Census Tracts with less than 3 acres of parkland per 1,000 residents.
- 8.9 million people, 24% of Californians, had no park within a half mile of their homes.
This analysis was conducted again in 2020 for California's Statewide Comprehensive Outdoor Plan (SCORP) and found that:
- 61% of Californians live in Census Tracts with less than 3 acres of parkland per 1,000 residents.
- 8.3 million people, 21% of Californians, have no park within a half mile of their homes.
This high-level scan of the larger landscape is important for driving policy and legislative priorities at multiple levels of government, but the site-specific Community FactFinder is essential for making informed decisions about park areas.
While it is necessary to use statewide data for consistent results, that does not mean the process is automatic and simply mathematical. In a state as large and complex as California, caution should be used before mapping which Census boundaries have the highest priority for grant funding. Mapping Census boundaries that have high poverty or low park acreage with approaches such as the Park Access Tool can be a useful "high level scan" but may not be the best approach for site-specific data.
Mapping based on what is in the project's Census boundary does not take into account what is in the adjacent Block, Block Group, or Tract. For example, one Census Block Group may have a five-acre park. The adjacent Census Block Group, a few hundred feet away, does not have a park. That adjacent Census Block Group would be "mapped" as being underserved when in reality the residents have a five-acre park a few hundred feet away in the adjacent Census boundary.
For the above reasons, the Community FactFinder approach of calculating site-specific data, which may include multiple census boundaries within a project area's half mile circle, is a more accurate tool for grant programs. To assess park acreage and demographic data surrounding specific project sites, tools that only calculate what is within one census boundary do not take into account park acreage and demographic data of what exists in adjacent boundaries, which may be only a few hundred feet away of the project site's census boundary.
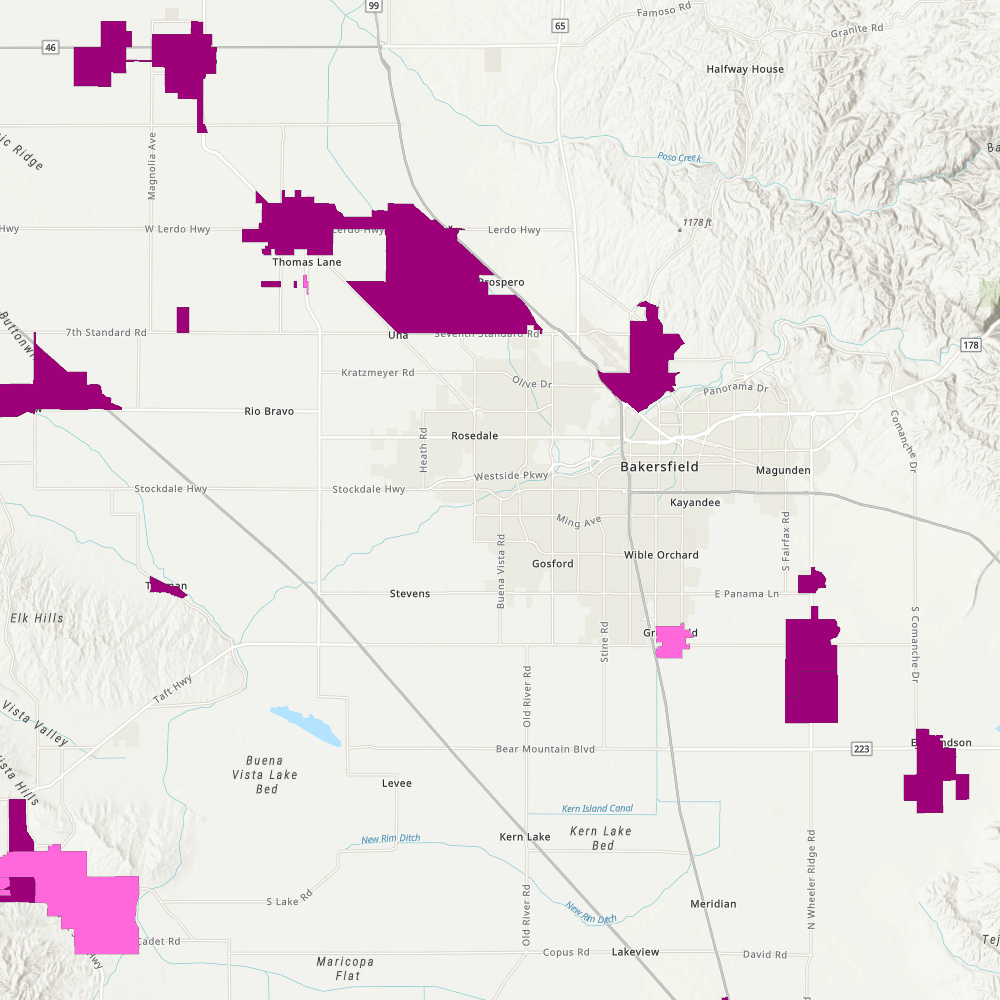
Department of Water Resources Disadvantage Communities Mapping Tool
The Department of Water Resources (DWR) has a Disadvantaged Communities Mapping Tool (gis.water.ca.gov/app/dacs/ ) that provides easy access to whether any given Census Designated Place, Tract, or Block Group qualifies as Disadvantaged or Severely Disadvantaged. Each Census level provides a very different picture:
Each of these geometry types serves a purpose in different analytical contexts, especially for funding measures that serve larger communities, such as water system investments or other large-scale infrastructure. At the Block Group level, this application can help in understanding issues directly related to residential water supply.
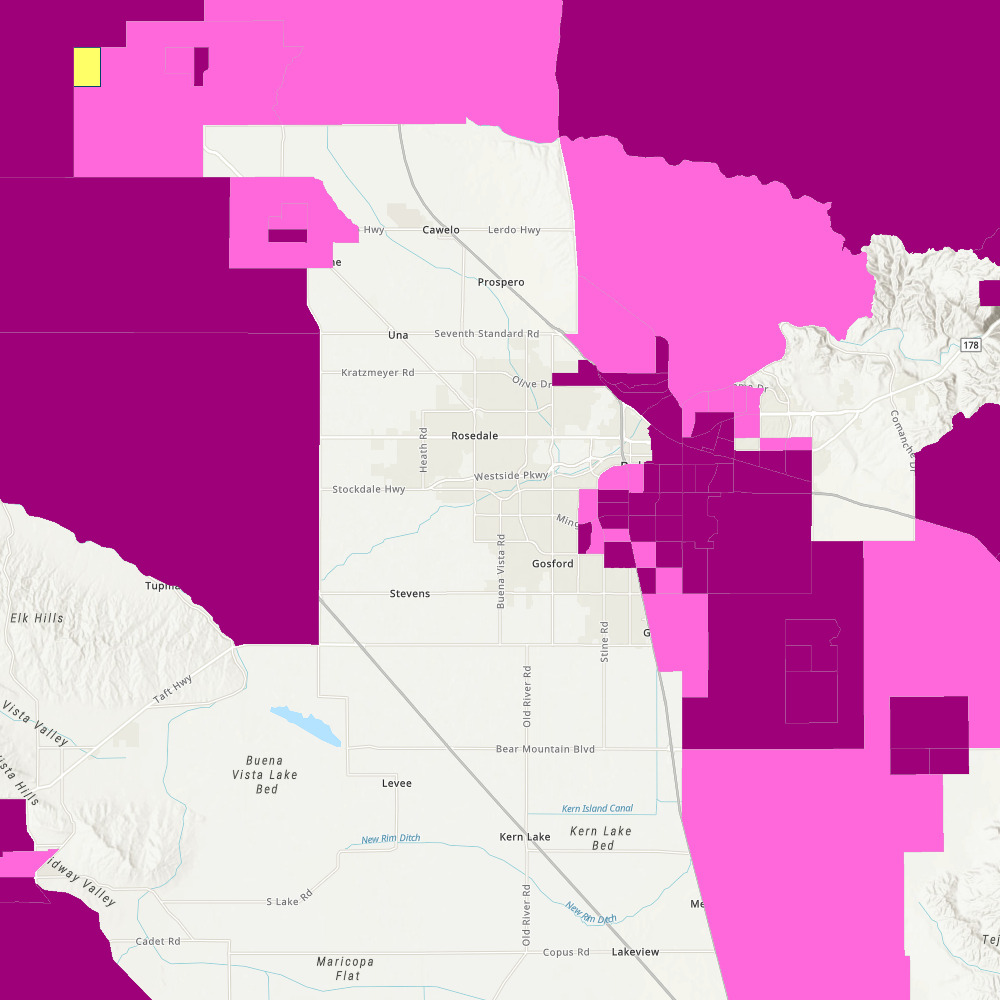
California Air Resources Board's California Climate Investments Project Map
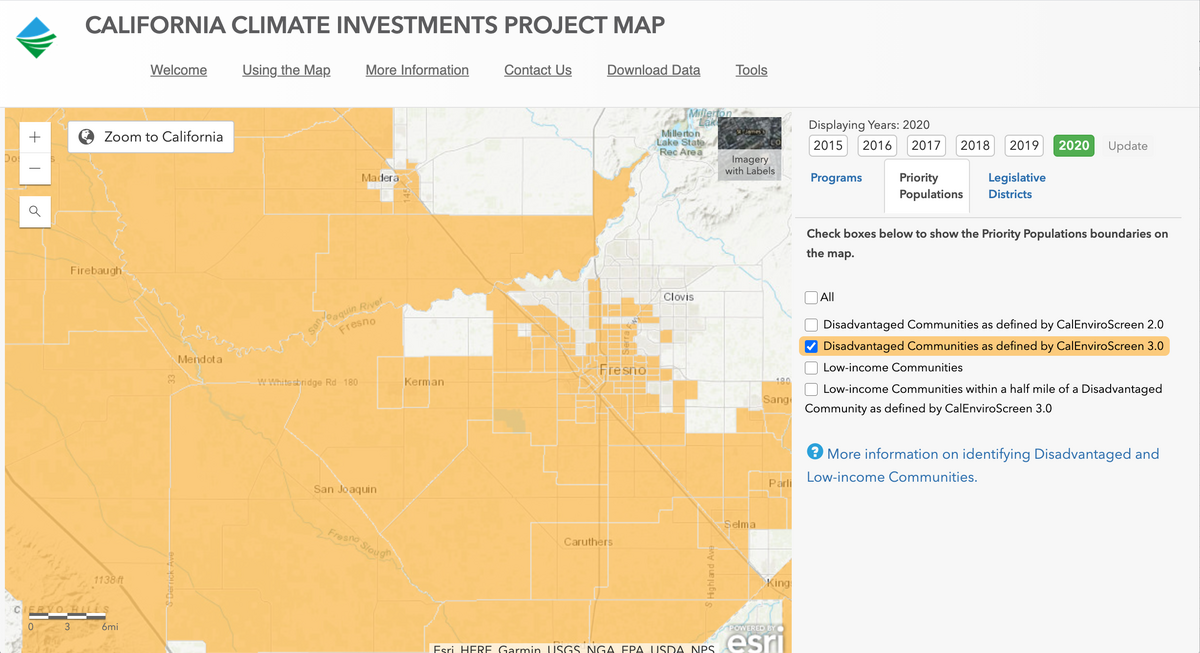
The California Air Resources Board's (CARB) California Climate Investments Project Map tool
(webmaps.arb.ca.gov/ccimap ) provides several different definitions of low-income and Disadvantaged Communities, all based on Census Tract boundaries. As shown above, the combined footprints of their various geometries provide yet another variation of whether any location is or is not disadvantaged.
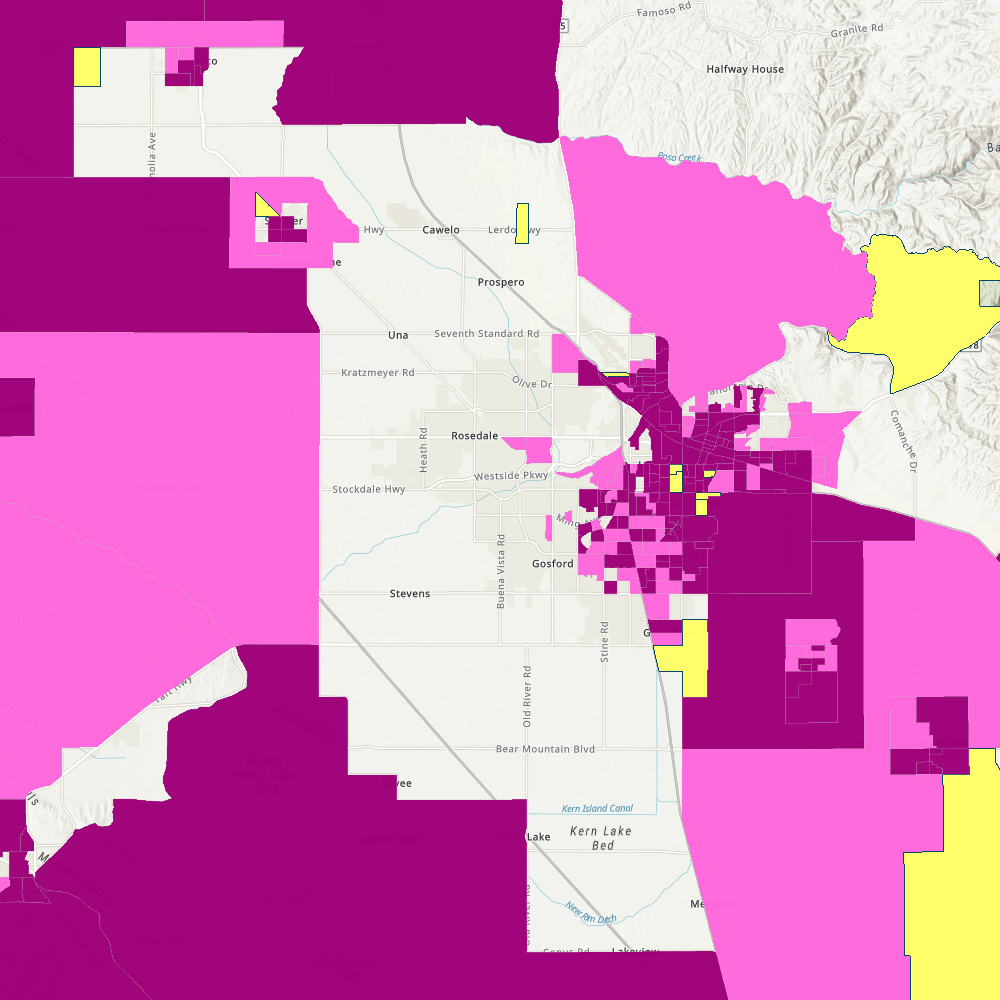
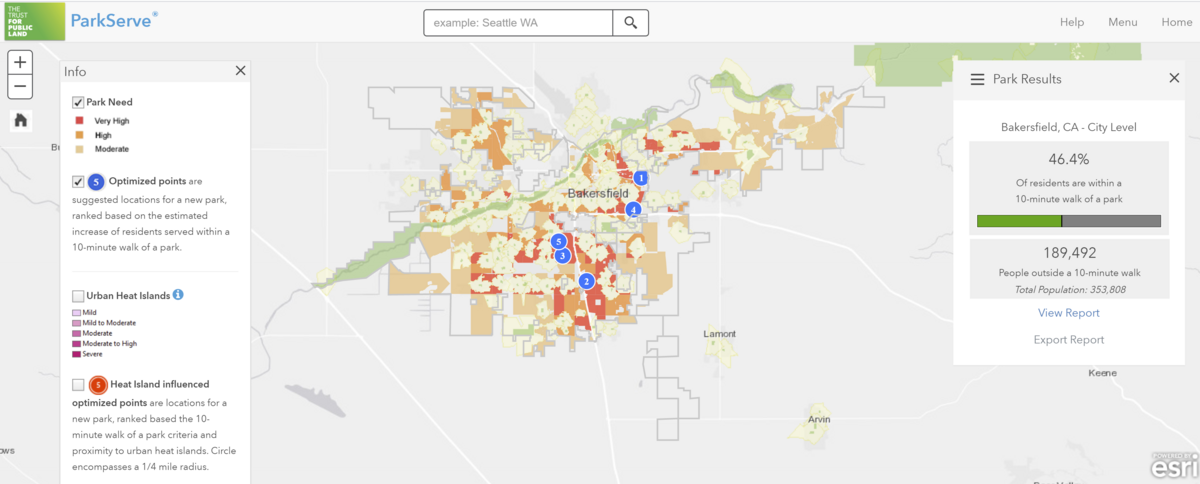
Trust for Public Land ParkServe
The Trust for Public Land's ParkServe tool (tpl.org/parkserve ) provides a resource for assessing park need at a community level across the entire nation. City-specific reports, as shown above for Bakersfield, are remarkably detailed for a national-scale tool. Especially in states that lack the resources and data for more accurate assessments, ParkServe can provide a floor of availability to ensure that communities across the country can engage in data-driven decision making about park equity.
However, as described on page 10, standards for what should be considered as park acreage may differ based on the uniqueness of grant programs. Furthermore, ParkServe is focused on urban and suburban areas and does not provide full geographic coverage for California. Community FactFinder works across the entire state, in urban, suburban, and rural areas.
ParkServe uses network analysis of a 10-minute walk, as opposed to a half mile radius. This helps with areas where a freeway or railroad might be impassable and a seemingly accessible park is actually inaccessible to a community very nearby.
Network analysis for walking routes specifically, to increase the accuracy of the 10-minute walk shed in all directions of a specific site, is a work in progress. There are shortcomings in available street and path network data accuracy statewide.
Network data to calculate a 10-minute walk from both commercial providers and open source projects is getting better with each passing year, so this would be an area to consider for future improvements to the Community FactFinder.
Placing Projects in Disadvantaged Communities
For some programs, it is more accurate to use a site-specific data calculator that captures the surrounding aggregate income within a radius of the project site, including multiple census boundaries which may exist within the project site's radius.
To identify if a project is in a disadvantaged community for some statewide competitive programs, it is more consistent to capture the aggregate income within a half-mile surrounding a project. As shown in this map example, the project site (pin) is in Census geometry that is not considered Disadvantaged. However, when calculating other Census geometry data in the project area's half-mile radius, the aggregate income is below the $56,982 threshold. This means the project area is in a Disadvantaged Community.
The Community FactFinder's half-mile radius uniformly quantifies the ratio of park space per 1,000 residents, number of people below poverty, and the median household income using consistent data available statewide. If the radius were larger, it could encompass higher income areas, or greater park acreage areas, which would disadvantage or disqualify many statewide applications.
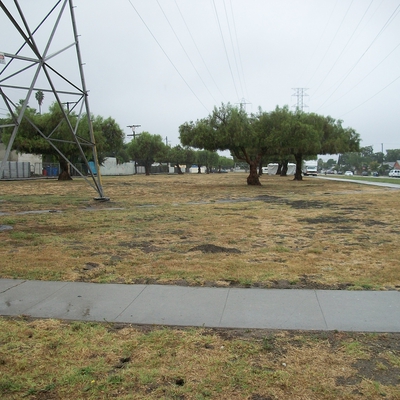
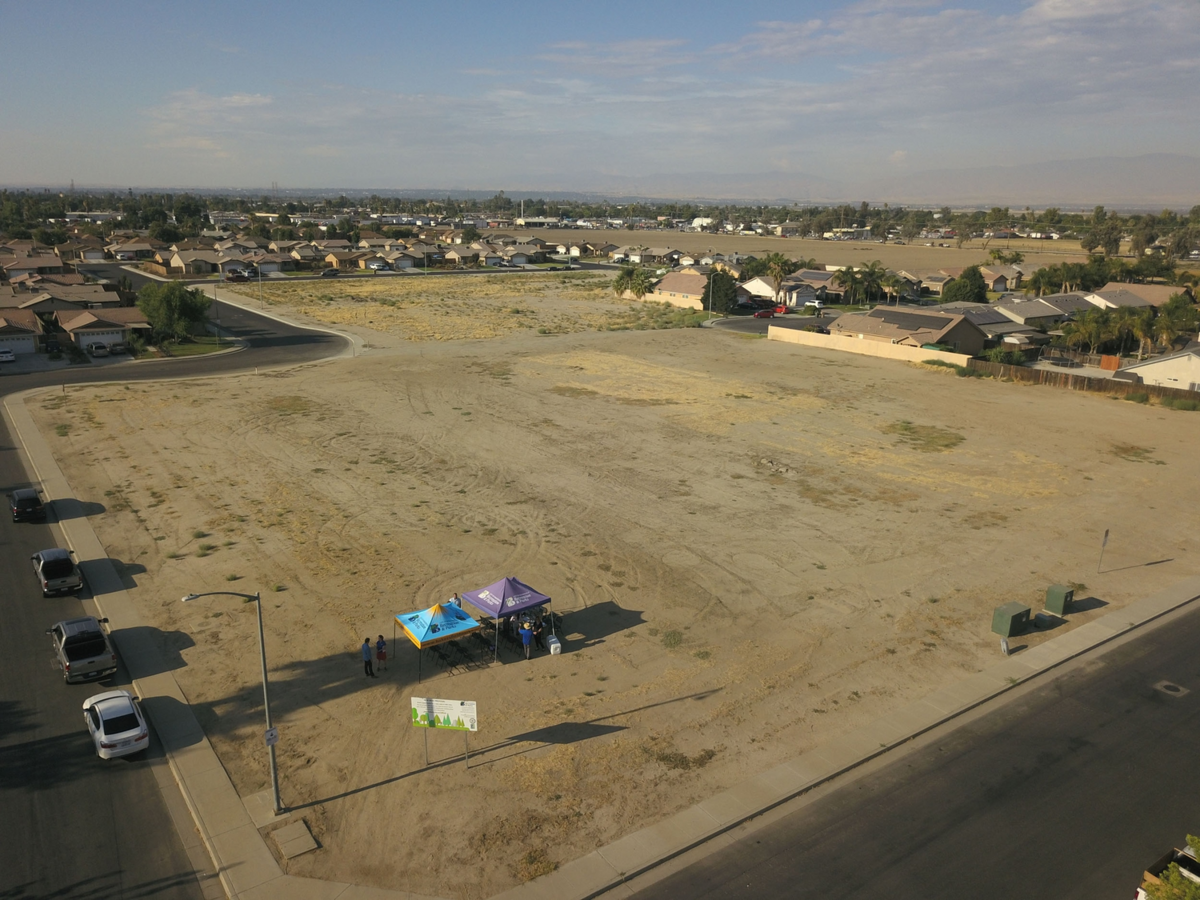
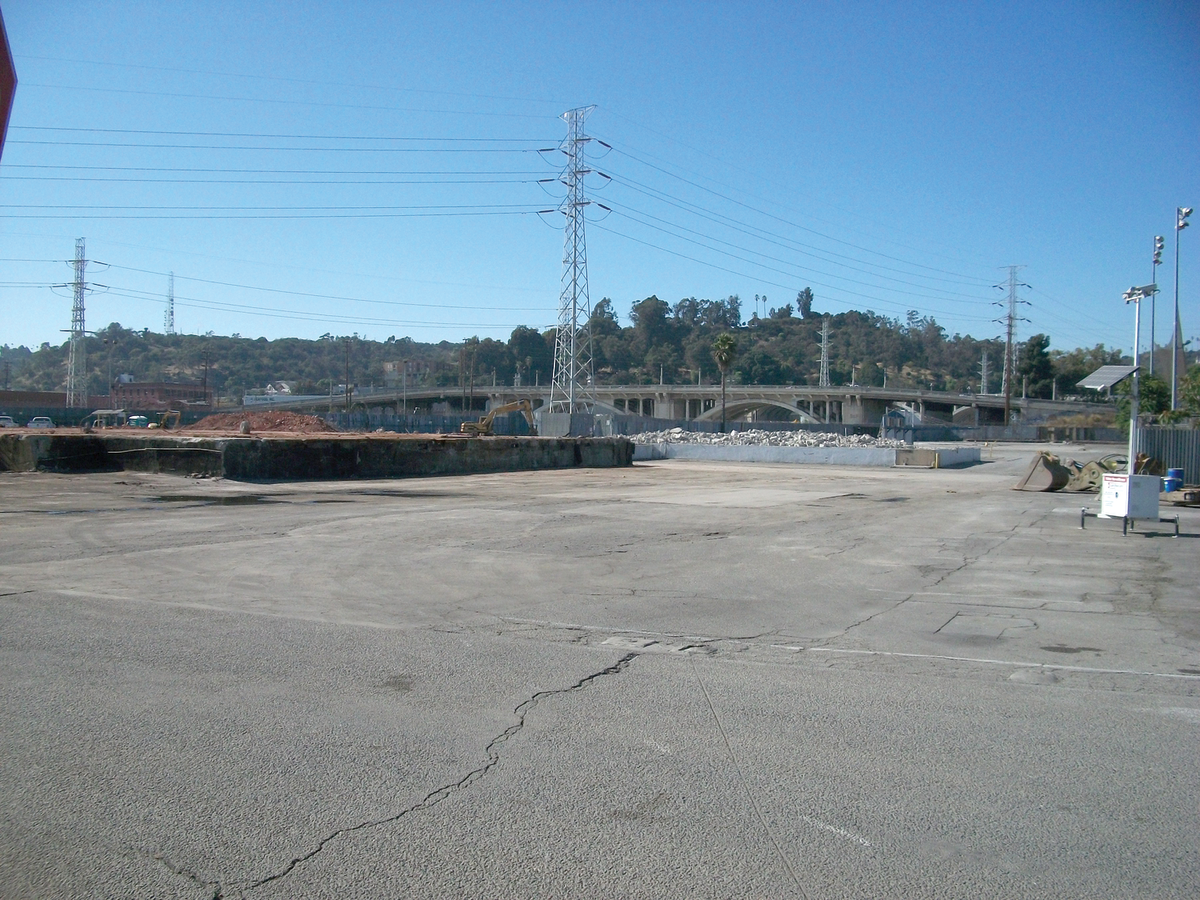
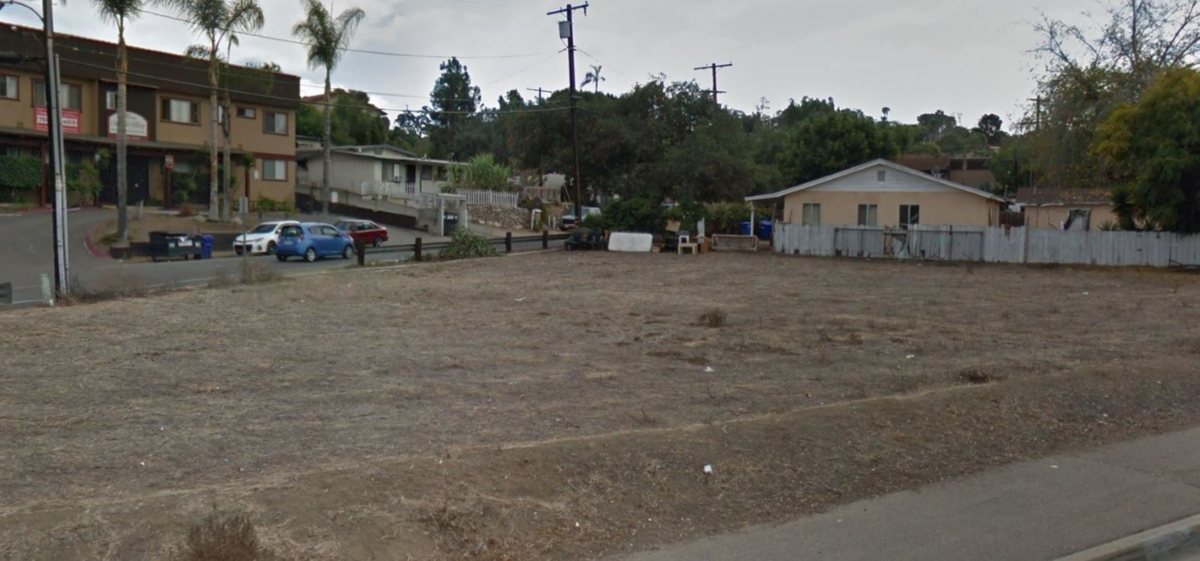
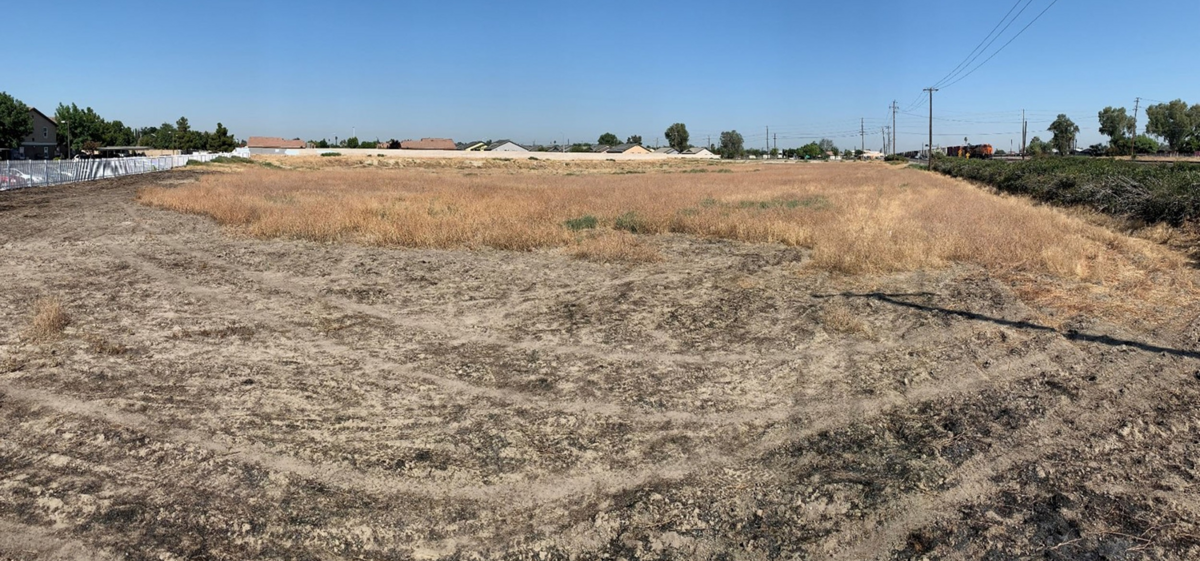
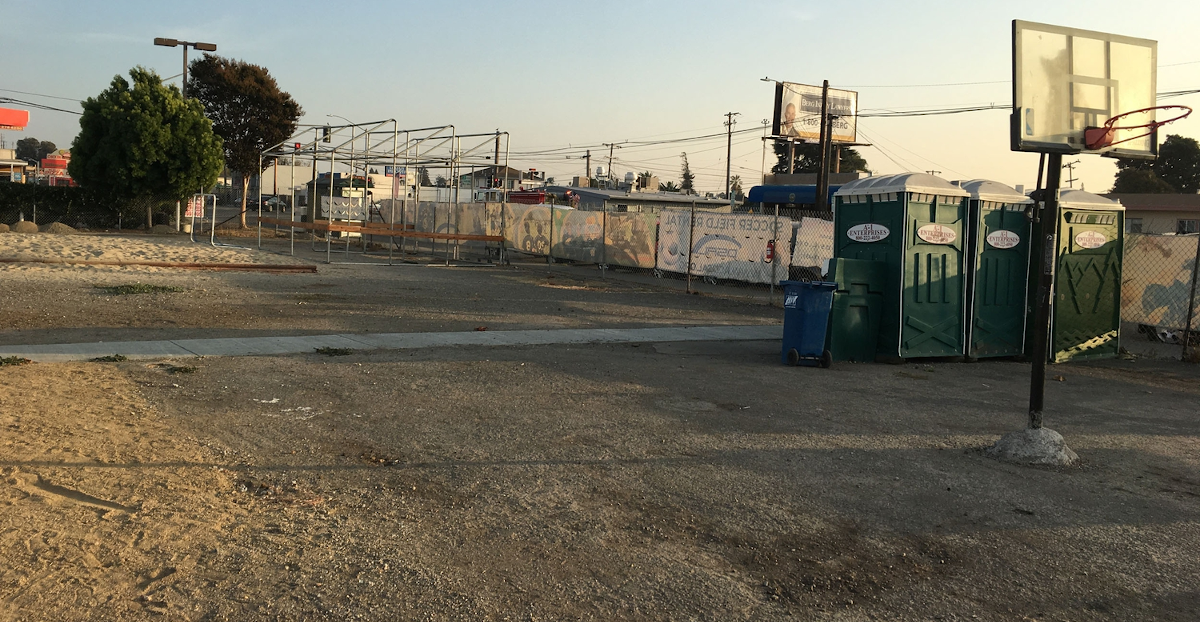
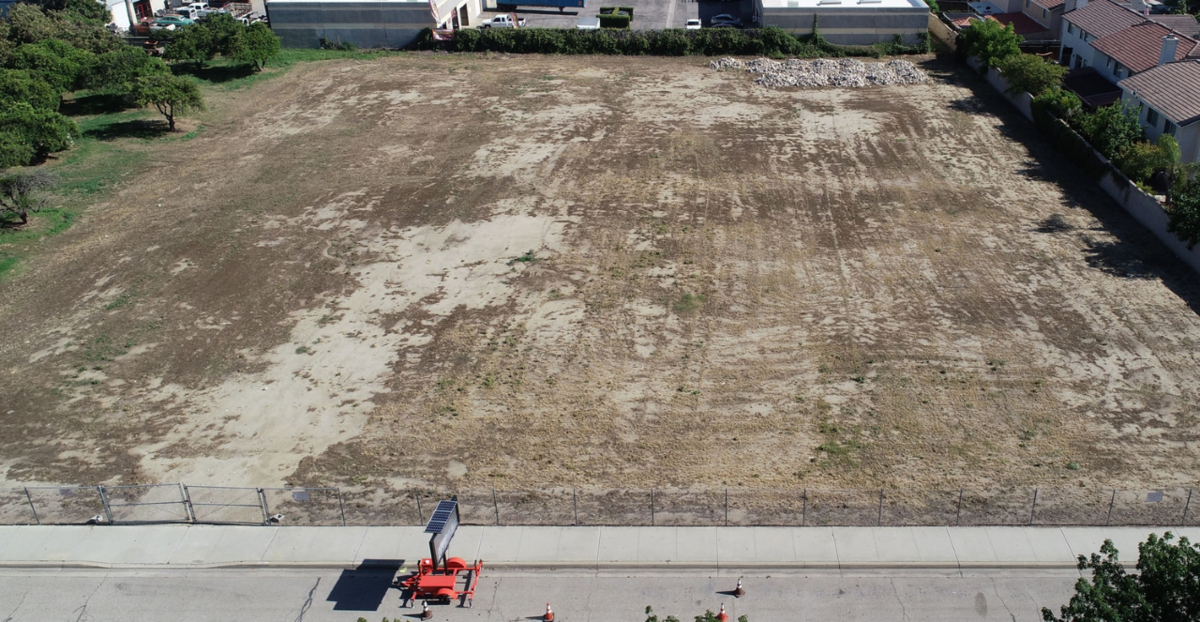
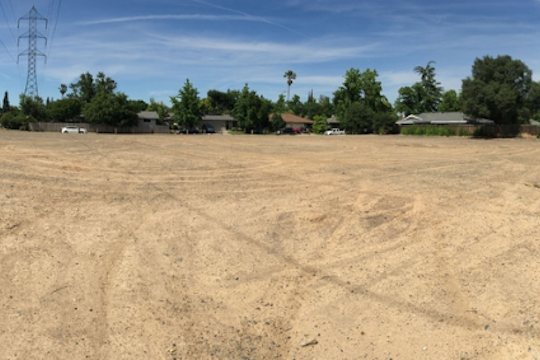
These sites are being developed into new parks through 2020 SPP grants. To learn more, visit www.parks.ca.gov/spp
Beginning with the 2008 development of the first statewide Community FactFinder and the Park Access Tool for the 2015–2020 SCORP, California provided a baseline for using park and demographics data to clearly and reliably understand park and community needs.
These tools support:
- Accountability: Data can be used to ensure projects are proposed in underserved communities.
- Transparency: All data are open to the public and free for use.
- Community: Tools help guide applicants to propose projects in high need areas. Data for parks are open to revisions and input, using open data principles to accept contribution and feedback. Improvements are vetted promptly and implemented consistently to ensure a uniform statewide database.
This combination of high-level data from the Park Access Tool and project site specific data from the Community FactFinder allows Californians to identify where parks are needed in relation to where people live. It helps to ensure that state funds for park access are distributed in ways that lift up and empower the California communities most in need, meeting the shared vision of policymakers, government staff, advocates, and the public.
- Continue updating the California Protected Area Database (CPAD) as a vital resource for assessing park access.
- Continue using the Community FactFinder for site specific data analysis.
- In 2025, release the next version of the Park Access Tool for the 2025–2030 SCORP, building upon the 2015–2020 and 2021–2025 editions.
- Monitor data and technology for improvements, especially in these areas:
- Network analysis for walking routes specifically, to increase the accuracy of the 10-minute walk shed of each park, excluding areas that are impassable due to freeways, railroads, or other areas impassable to pedestrians.
- Accessible mapping technologies for low- and no-vision users.
- Participatory mapping technologies that enable community members to provide spatially specific comments, images, and stories about park design and park access in their neighborhoods.
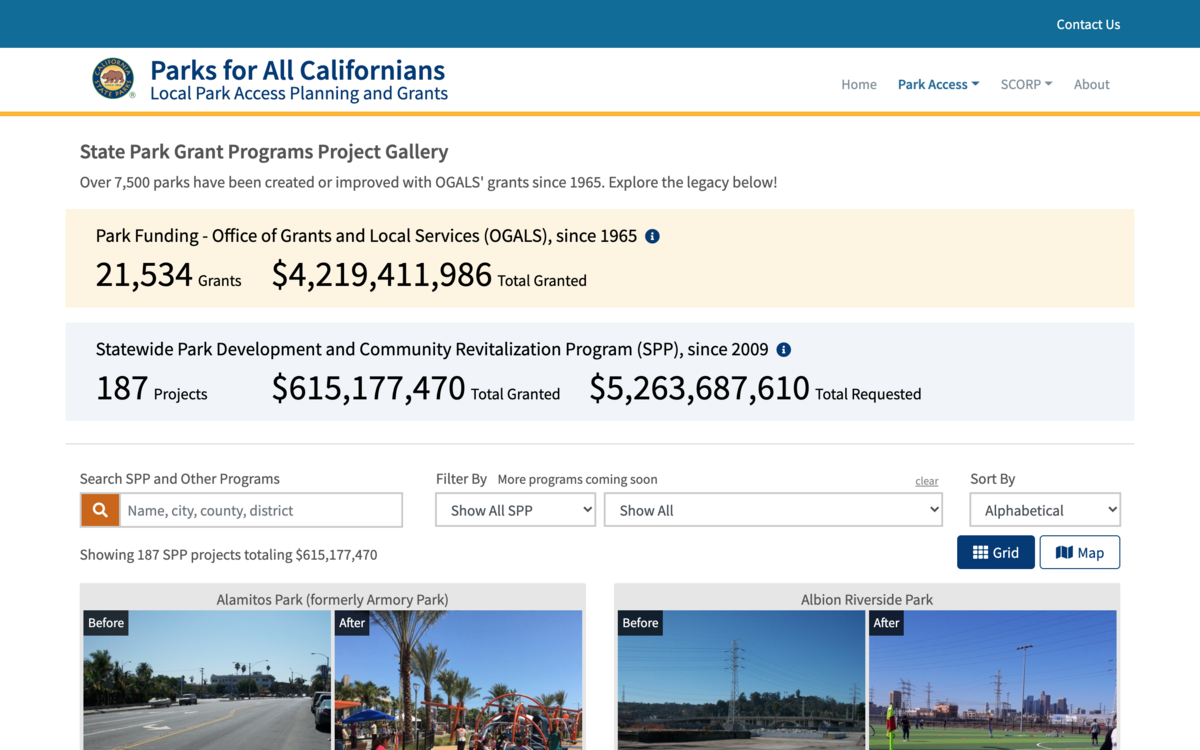
ParksForCalifornia.org
The online home of the 2021–2025 SCORP provides a range of user-friendly resources and tools:
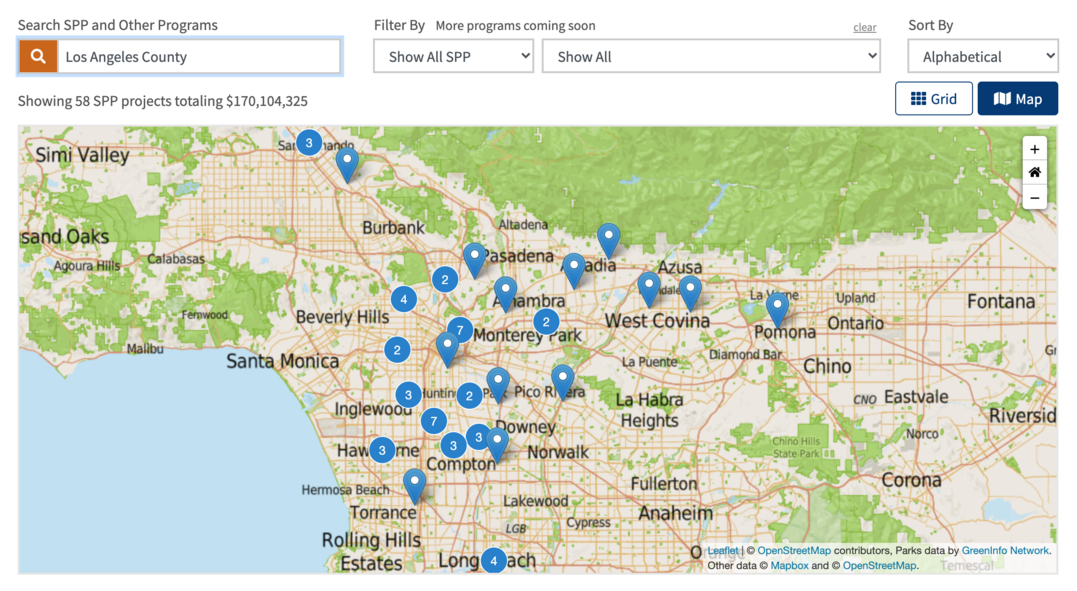
The Project Gallery showcases thousands of projects that have used federal and state funds to make accessible parklands.
- Search by funding type or location, including cities, counties, and legislative districts.
- View the results as a photo gallery or on a map.
Use the Park Access Tool to get a high-level picture of park access for the entire state or any county, city, or legislative district in California.
Use the Community FactFinder for site-specific data to help determine the level of need for any project area throughout California.
Department Mission
The mission of the California Department of Parks and Recreation is to provide for the health, inspiration, and education of the people of California by helping to preserve the state's extraordinary biological diversity, protecting its most valued natural and cultural resources, and creating opportunities for high-quality outdoor recreation.
Community Engagement Division Mission
Encouraging healthy communities by connecting people to parks, supporting innovative recreational opportunities, embracing diversity, fostering inclusivity, and delivering superior customer service, with integrity for the enrichment of all.
This report is produced by the California Department of Parks and Recreation's Community Engagement Division — Office of Grants and Local Services (OGALS). Since 1965, more than 7,580 parks throughout California have been created or improved with grants administered by OGALS. Currently, over 700 local agencies partner with OGALS to improve the health and wellness of California's 40 million residents by providing close to home park access.
OGALS GRANTS: parks.ca.gov/grants | Email: SCORP@parks.ca.gov
OGALS street address:
California Department of Parks and Recreation | Office of Grants and Local Services
1416 Ninth Street, Room 918 | Sacramento, CA 95814